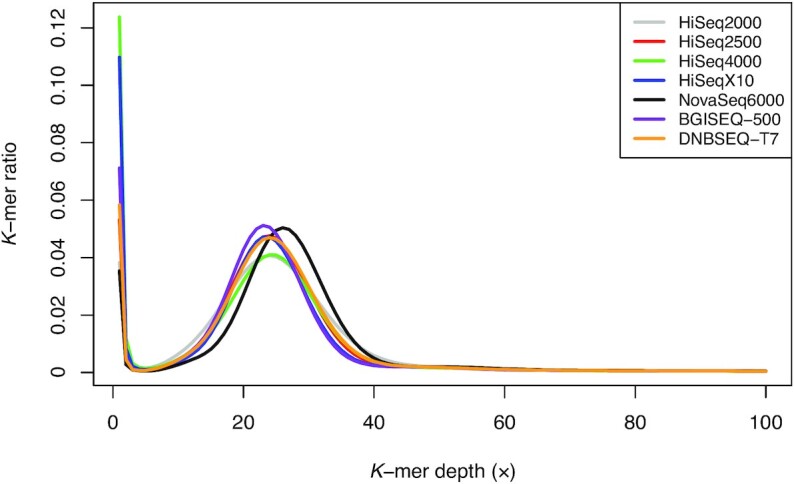
Figure 1:

Distribution of k-mer frequency for 21-mers using raw reads from 7 sequencing platforms. The x-axis represents k-mer depth, and the y-axis represents the proportion of k-mers, as calculated by the frequency at that depth divided by the total frequency at all depths.
