Figure 2:

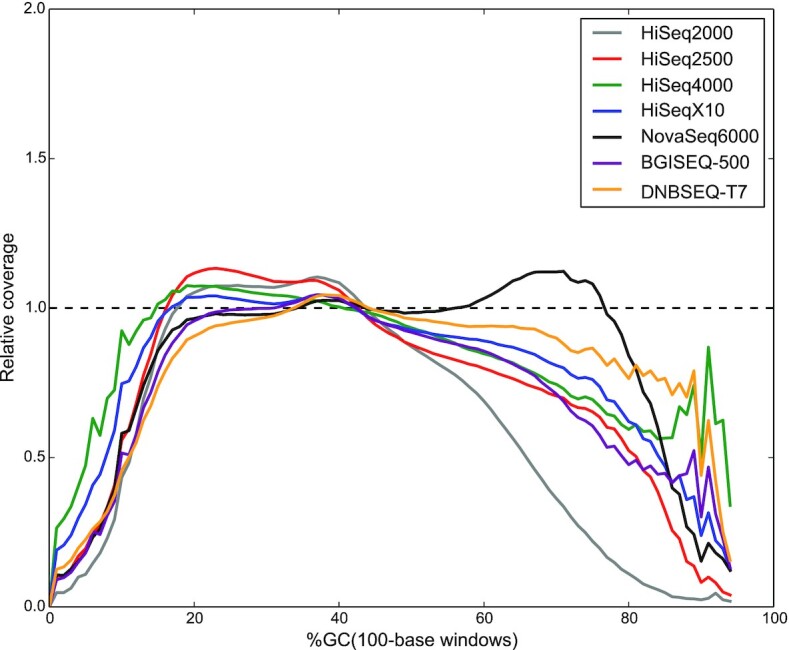
GC-bias plots for 7 sequencing platforms. Unbiased coverage is represented by a horizontal dashed line at relative coverage = 1. A relative coverage <1 indicates lower than expected coverage and >1 indicates higher than expected coverage.

GC-bias plots for 7 sequencing platforms. Unbiased coverage is represented by a horizontal dashed line at relative coverage = 1. A relative coverage <1 indicates lower than expected coverage and >1 indicates higher than expected coverage.