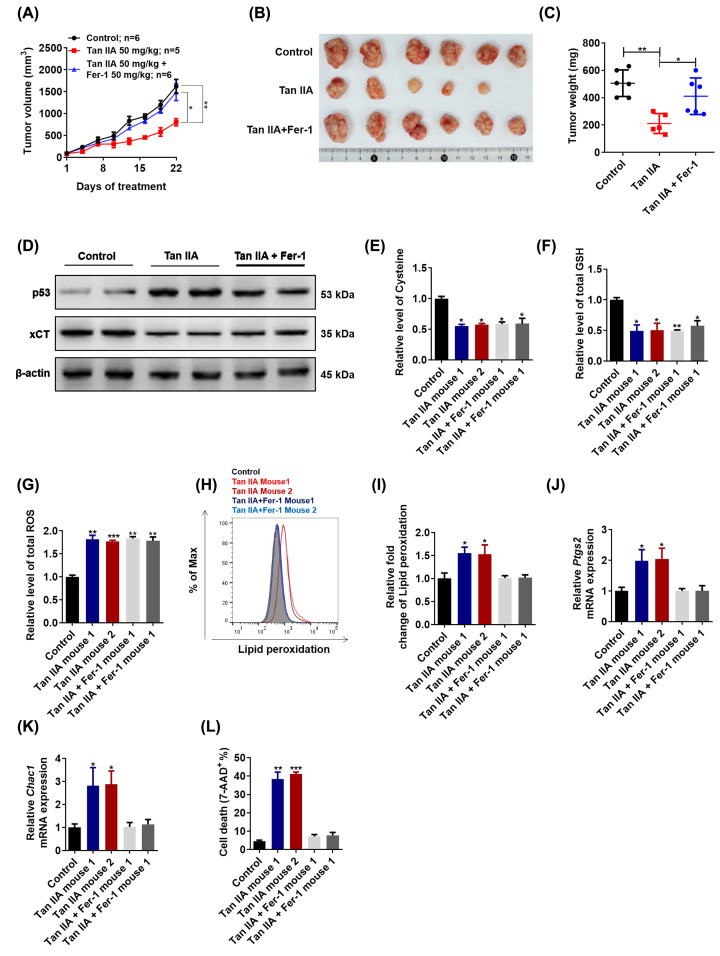
Figure 4. Tan IIA suppresses tumor growth and induces ferroptosis in vivo.
(A) Mice were treated with Tan IIA (50 mg/kg), Fer-1 (50 mg/kg) and Tan IIA (50 mg/kg) combined with Fer-1 (50 mg/kg) for 3 weeks, tumor volume was measured every 3 days (n=5–6). (B, C) After treatment with Tan IIA (50 mg/kg), Fer-1 (50 mg/kg) and Tan IIA (50 mg/kg) combined with Fer-1 (50 mg/kg) for 3 weeks, tumors in these groups were removed, tumor pictures were captured (B) and tumors were weighed (C).
(D) A total of 20 mg tumor tissue in two mice of each group was isolated. The expression of p53 and xCT was detected by Western Blot and RT-qPCR. (E–G) A total of 20 mg tumor tissue in two mice of each group was isolated, intracellular cysteine level, GSH level and ROS level were measured. (H, I) A total of 20 mg tumor tissue in two mice of each group was isolated and digested into single cell. Then the cells of each group were stained with BODIPY™ 581/591 C11 and lipid peroxidation was analyzed by flow cytometry. (J, K) A total of 20 mg tumor tissue in two mice of each group was isolated and total RNA sample was extracted. The expression of two marker genes, Ptgs2 and Chac1 was detected by RT-qPCR. (L) A total of 20 mg tumor tissue in two mice of each group was isolated and digested into single cell. Then the cells of each group were stained with 7-AAD and cell death was analyzed by flow cytometry. Data are shown as the mean ± SD (n=3). *P<0.05 vs control group; **P<0.01 vs control group; ***P<0.001 vs control group.

