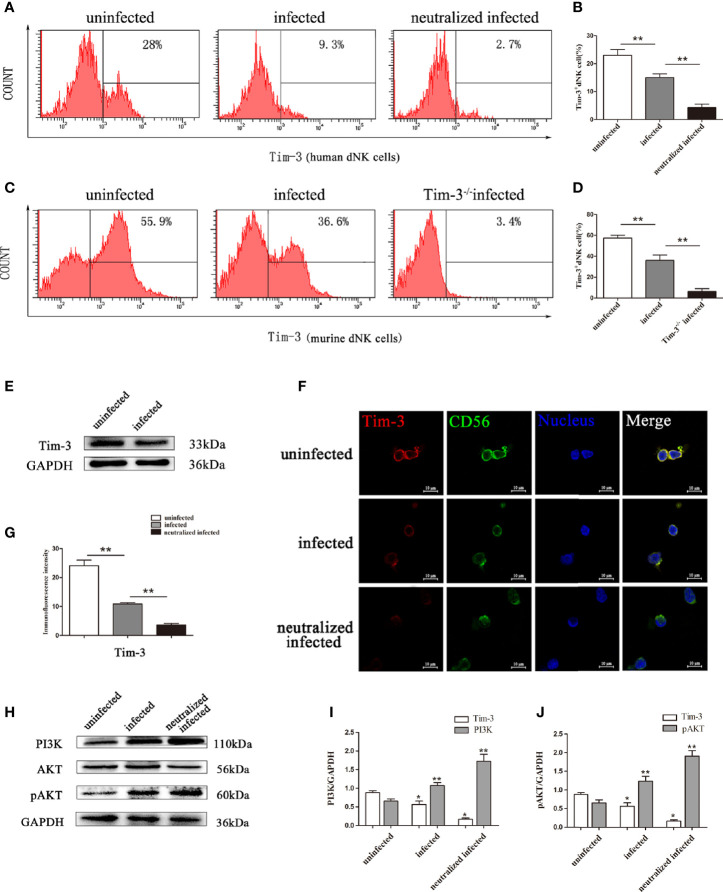
Figure 2.
Changes of Tim-3 expressions on dNK cells due to T. gondii infection. (A) Expression levels of Tim-3 on human CD3-CD56bright dNK cells in uninfected, infected, and anti-Tim-3 neutralized infected groups using flow cytometry. (B) Histograms analysis of Tim-3 expression changes on human dNK cells in the three groups. (Means ± SD; N=6 human samples per group, *p < 0.05, **p < 0.01, by unpaired t-test). (C) Expression of Tim-3 on mice CD3-CD122+ dNK cells in uninfected, infected, and Tim-3-/- mice infected groups were detected by flow cytometry. (D) Histograms analysis of Tim-3 expression changes on mice dNK cells in uninfected, infected, and Tim-3-/- mice infected groups. (Means ± SD, N=8 mice per group, *p < 0.05, **p < 0.01, by unpaired t-test). (E) Western blot analysis of Tim-3 expression in uninfected human dNK cells and infected groups. (F) Immunofluorescent photographs of Tim-3 (red), CD56 (green) expression on the purified human CD3-CD56bright dNK cells from uninfected, infected, and Tim-3-neutralized and infected groups. The 4 ‘, 6-diamidino-2-phenylindole were used to stain nuclei (blue). Scale bar, 10µm. (G) Histograms analysis of Tim-3 expressions changes on human dNK cells by immunofluorescent intensity among three groups. (H) Representative depictions of Tim-3 downstream molecules PI3K, AKT and pAKT expressions in uninfected, infected, and Tim-3-neutralized infected human dNK cells by western blot. (I, J) The histograms analysis of Tim-3, PI3K and pAKT among three groups. (Means ± SD; N=6 human samples per group, *p < 0.05, **p < 0.01, by unpaired t-test).

