Figure 6.
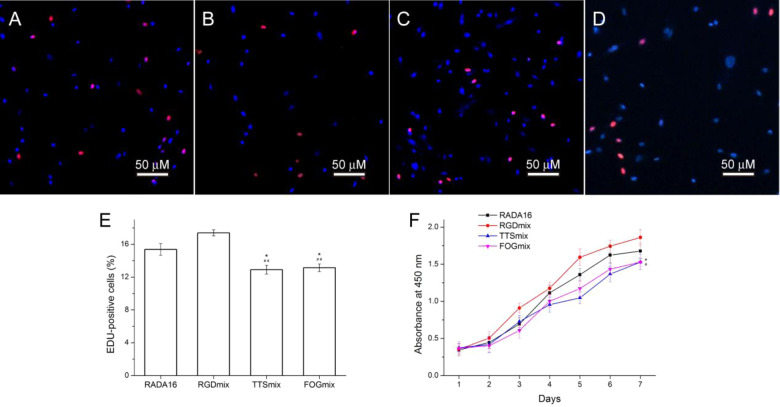
EdU Staining of hAMSCs encapsulated in hydrogels (A) RADA16, (B) RGDmix, (C) TTSmix and (D) FOGmix after 3 days of culture (red: EdU; blue: Hoechst 33342 for nuclei staining); and (E) percentage of EdU-positive hAMSCs (%). 15.37 ± 0.71, 17.40 ± 0.39, 12.91 ± 0.53 and 13.14 ± 0.46% of the hAMSCs encapsulated in RADA16, RGDmix, TTSmix and FOGmix were positive for EdU, respectively. *P < 0.05 compared with RADA16, ##P < 0.01 compared with RGDmix. All data shown are means ± SD of three independent experiments. (F) Proliferation curves of cultured hAMSCs as determined by the CCK-8 test. RGDmix: RADA-RGD+RADA16, TTSmix: RADA-TTS+RADA16, FOGmix: RADA-FOG+RADA16 (all mixture ratio is 7:3). individual RADA16 hydrogel (1% wt/vol) was used as control.

