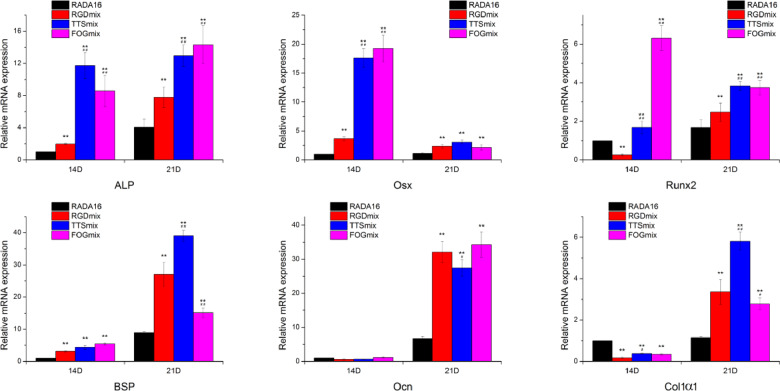
Figure 9.
Osteogenic gene expression of hAMSCs cultured in various hydrogels. The relative expression was analyzed by the 2-ΔΔCt method, with normalization by the Ct of GAPDH and calibrated to RADA16 group on Day 7. *P < 0.05, **P < 0.01 compared with RADA16. #P < 0.05, ##P < 0.01 compared with RGDmix. All data shown are means ± SD of three independent experiments. RGDmix: RADA-RGD+RADA16, TTSmix: RADA-TTS+RADA16, FOGmix: RADA-FOG+RADA16 (all mixture ratio is 7:3).

