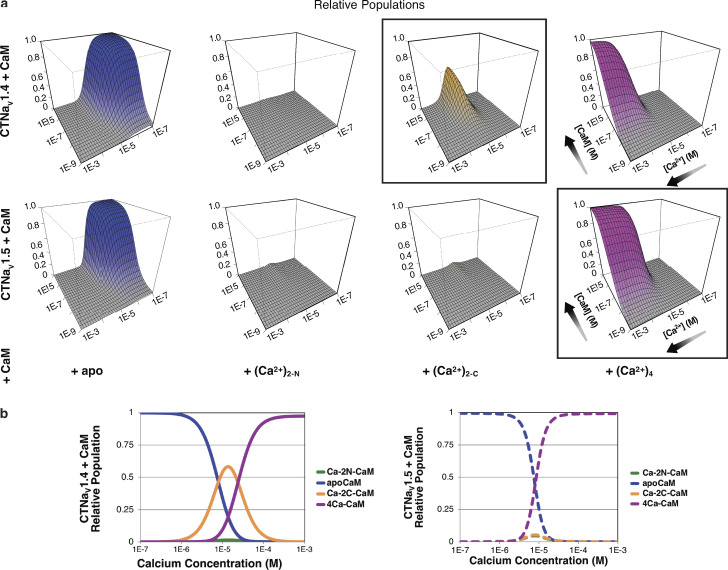
Figure 6.
Populations of CTNaV1.4 and CTNaV1.5 with bound CaM. (a) Panels show the relative population (z-axis) of four CaM species bound to CTNaV, as a function of Ca2+ and CaM concentration. Black boxes indicate the dominant species at high CaM and 10 µM Ca2+; (Ca2+)2C–CaM for CTNaV1.4 (top) and (Ca2+)4–CaM for CTNaV1.5 (bottom). (b) Cross-section showing populations of CTNaV (Ca2+)–CaM species as a function of [Ca2+] at a [CaM] of 10 µM. Note the dramatic reduction of (Ca2+)2C–CaM for CTNaV1.5 compared with CTNaV1.4. Adapted from Yoder et al. (2019).

