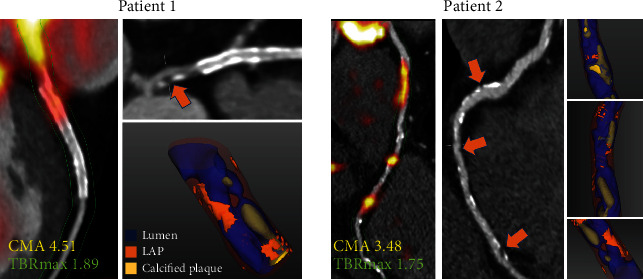
Figure 3.

Case examples of coronary 18F-sodium fluoride uptake. Low attenuation plaque (LAP) on CT angiography and LAP (orange arrows) on 3D CT rendering. Right (Patient 1) and left anterior descending (Patient 2) coronary arteries. Areas of LAP correspond with areas of increased 18F-NaF activity. While maximum target-to-background ratio (TBRmax) reflects single hotspot activity, coronary microcalcification activity (CMA) values represent the whole-vessel 18F-sodium fluoride burden. Reprinted by permission from Springer Nature: EJNMMI (Kwiecinski et al. [61]).
