Fig. 8.

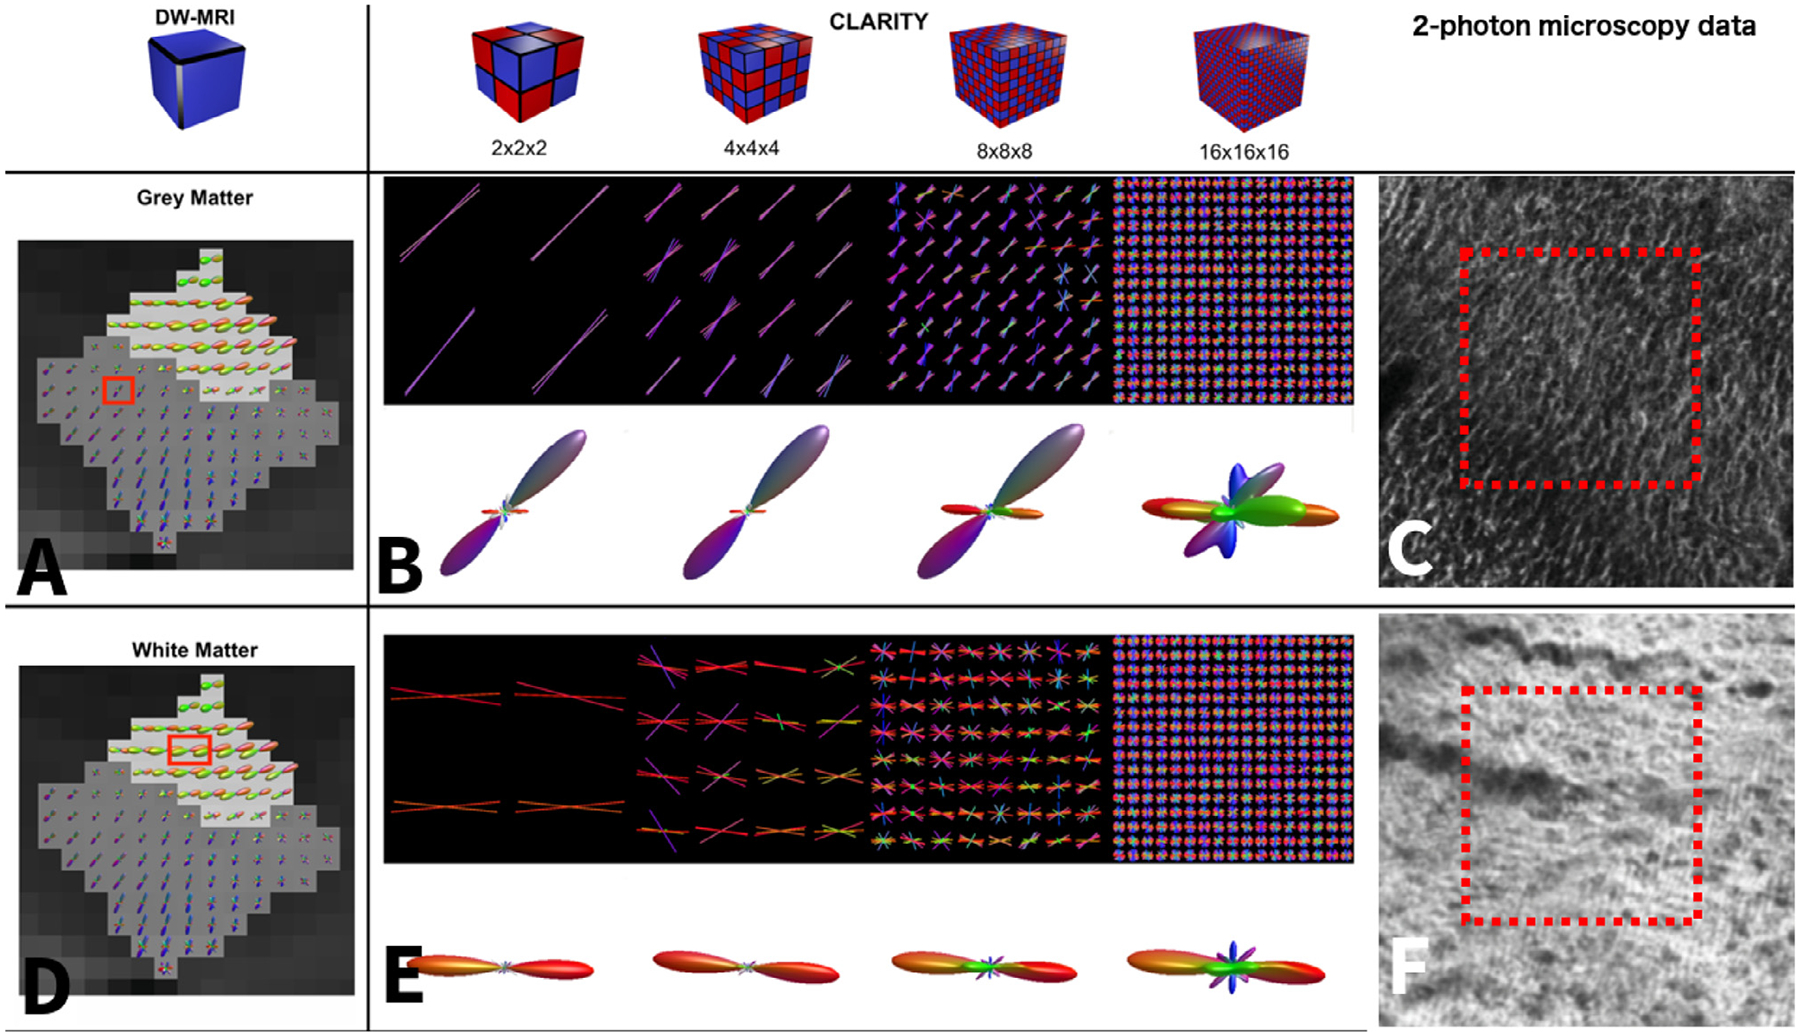
Macaque visual cortex characterization of CLARITY-derived crossing fiber estimates. A and D show fODF estimates using constrained spherical deconvolution calculated from the NIH macaque data (Thomas et al., 2014). The gray matter has a dark gray background and the white matter has a light gray background. B and E show the sODF calculated from the CLARITY two-photon microscopy data with varying sub-voxel sizes. To facilitate visual comparison with the dMRI data, the sODF was concatenated over the whole 250 μm voxel size, and a spherical harmonics function was fitted to the final sODF using MrTrix (Tournier et al., 2019). In A, a gray matter voxel is highlighted on top of the dMRI fODF reconstruction. The sODF of the corresponding voxel in the two-photon microscopy data is shown in B. The first row shows the primary structure tensor orientations for each of the sub-voxels projected on a single plane, the second row shows the corresponding sODF. In D, a white matter voxel is highlighted on top of the dMRI fODF reconstruction. The sODF of the corresponding voxel in the two-photon microscopy data is shown in E. The number of detected peaks increases for smaller sub-voxel sizes. C and F show a close-up view of the 2-photon microscopy data.
