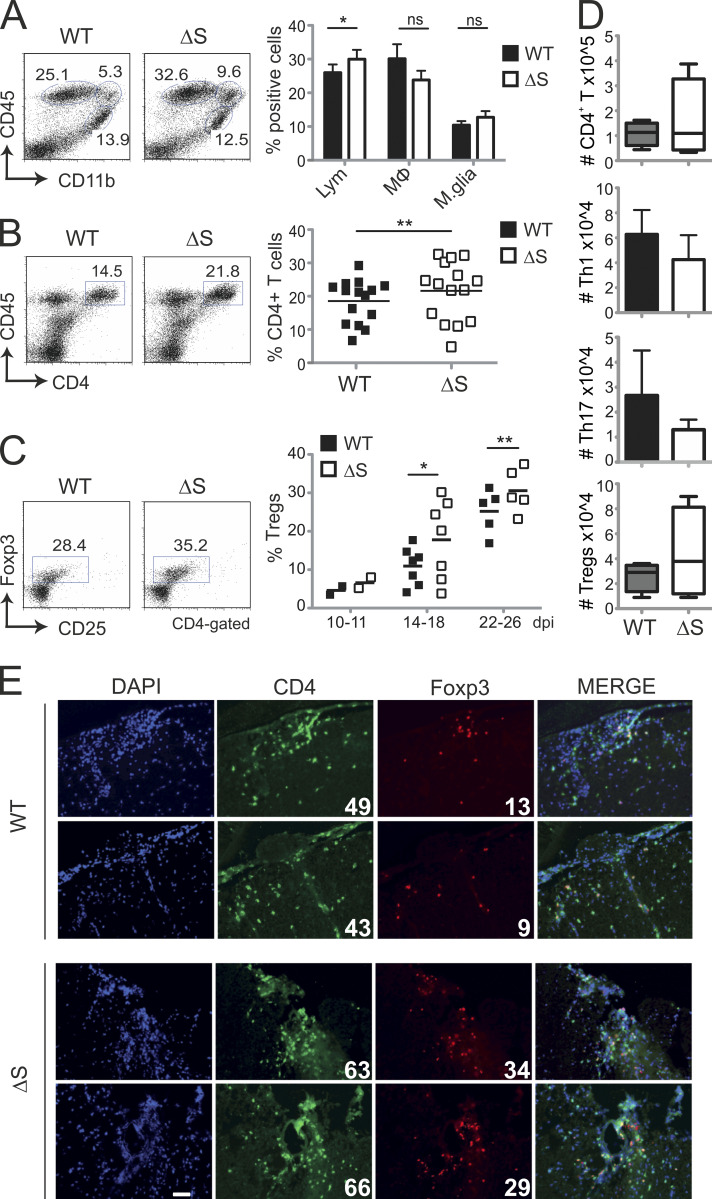
Figure 4.
EAE-diseased Nfatc1deltaSUMO mice exhibit more T regs in the CNS. (A) Flow cytometric analysis of CNS-infiltrating cells isolated from EAE-diseased WT and Nfatc1deltaSUMO mice: lymphocytes (CD45highCD11b−), macrophages and neutrophils (CD45highCD11bhigh), and microglia cells (CD45lowCD11bhigh). Shown are representative flow cytometry plots and the statistical evaluation of 15 mice/group. Student’s t test; *, P < 0.05. Mean + SEM. (B) Frequency of CD4+ T cells within CNS infiltrates of EAE-diseased WT and Nfatc1deltaSUMO mice. Shown are representative flow cytometry plots and the compilation of 15 mice/group. Student’s t test; **, P < 0.005. Mean + SEM. (C) Detection of T regs in the CNS of WT and Nfatc1deltaSUMO mice after EAE induction by flow cytometry. CNS infiltrates were stained for CD4, CD25, and intracellular Foxp3 on the indicated days after EAE induction. Shown are representative plots and the statistical evaluation. Differences between groups were calculated with Student’s t test; *, P < 0.05; **, P < 0.005. Mean + SEM. (D) Absolute cell numbers (number in CNS-collected cells × percent CD4+ [n = 4] × percent IFN-γ+ [n = 3], IL-17+ [n = 3], or Foxp3+ [n = 4]) were determined on days 22–26. (E) Immunofluorescence staining of spinal cord cryosections of WT and Nfatc1deltaSUMO EAE-induced mice (magnification, 40×; scale bar, 20 µm). Sections were stained with anti-CD4 (Alexa Fluor 488), anti-Foxp3 (Cy3), and DAPI. Shown are two individual spinal cords for both genotypes each. White numbers indicate counted (in a blinded manner) CD4+ and Foxp3+ cells.

