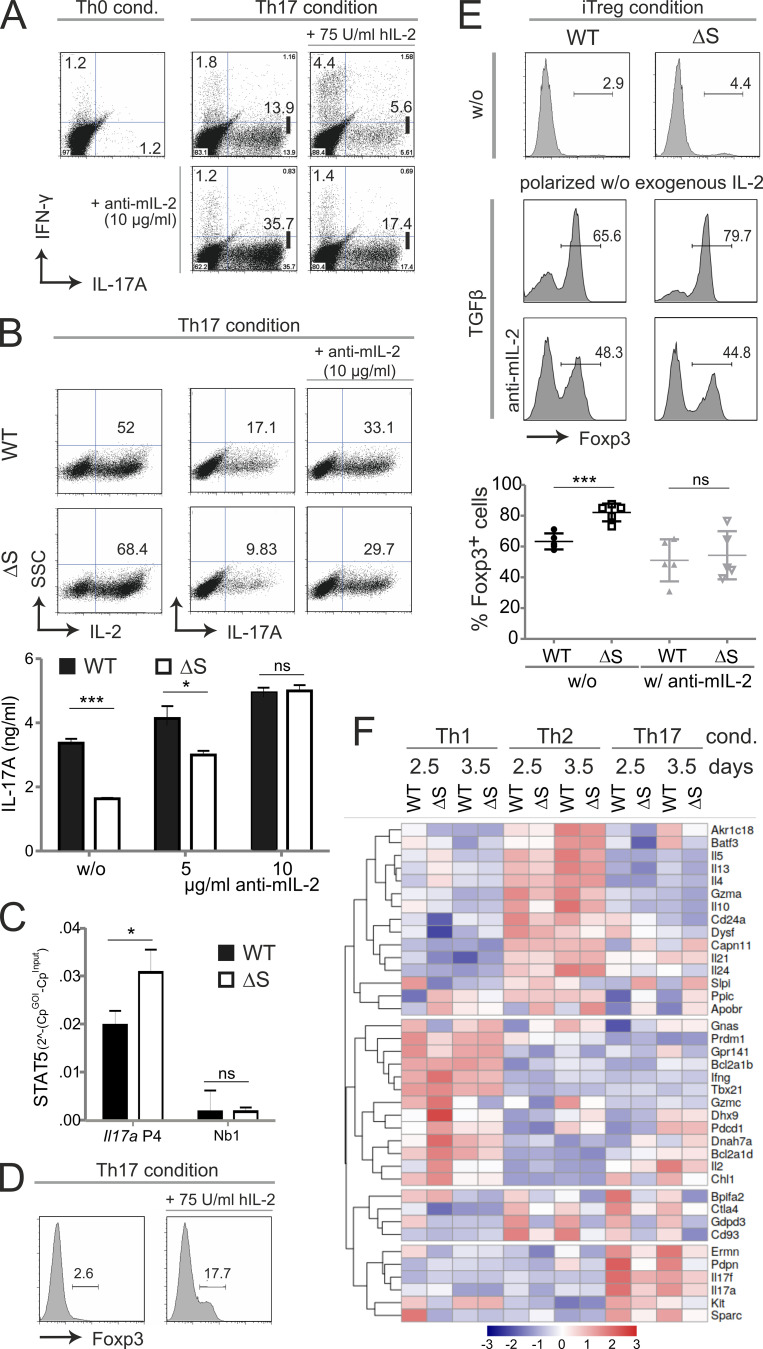
Figure 5.
NFATc1/ΔS-induced overexpression of IL-2 limits IL-17A production and favors Foxp3 expression. (A) Th17 differentiation of naive CD4+ WT T cells with the addition of human IL-2 (75 U/ml) and/or anti-murine IL-2–neutralizing antibodies (10 µg/ml). On day 3, Th17 cells were restimulated with T/I followed by intracellular cytokine staining of IL-17A and IFN-γ. Shown are representative flow cytometry plots of Th0 (control) and Th17 cultures of three individual experiments. (B) Th17 differentiation of naive CD4+ T cells gained from WT and Nfatc1deltaSUMO mice under normal and mIL-2–neutralizing conditions as performed for A. Representative flow cytometry plots of intracellular staining of IL-2 and IL-17A of three individual experiments. Amount of secreted IL-17 was determined from the supernatants of Th17 cultures (n = 6) with increasing concentrations of anti–mIL-2. (C) ChIP assay of Th17-differented cells for STAT5 bound to Il17 promoter (site 4) and a nonbinding site (n = 4). (D) Foxp3+ expression was evaluated in WT CD4+ T cells after the addition of IL-2 (75 U/ml rhIL-2) to otherwise Th17-inducing conditions; analyzed by intracellular flow cytometry on day 3. (E) Naive CD4+ T cells from WT and Nfatc1deltaSUMO mice were polarized to iT regs by supplementation with TGFβ, but without the addition of exogenous IL-2; parallel cultures were in the presence of 10 µg/ml anti–mIL-2. On day 3, cells were analyzed by intracellular flow cytometry of Foxp3. Data are shown as representative flow cytometry plots for Foxp3+ cells. Statistics were evaluated from five individual experiments. Statistical evaluation for B, C, and E was achieved by Student’s t test, two-tailed (*, P < 0.05; ***, P < 0.001); mean + SD. (F) CD4+ T cells, isolated from LN and spleen, were differentiated for Th1, Th2, and Th17. On days 2.5 and 3.5, RNA was extracted and subjected to NGS. The heatmap shows 38 differentially expressed genes within all WT versus NFATc1/ΔS+ T cells of both days determined using the edgeR’s glm model.

