Figure 1.
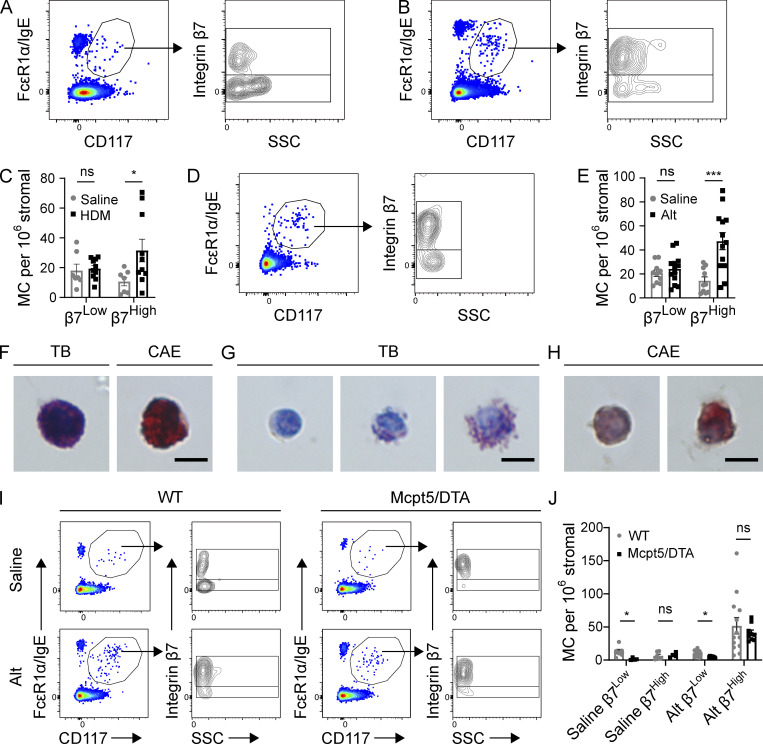
Aeroallergen challenges induce the expansion of β7High MCs in C57BL/6 mice. (A) Representative flow plots showing airway MCs in naive mice, pregated on CD45+ Lin− (CD4, CD8, CD19, CD11b, CD11c) cells (left), further subdivided by β7 integrin and SSC (right). Flow plots are representative of three independent experiments. (B) Representative flow plots showing airway MCs from the lungs of mice challenged twice per week for 3 wk with 3 µg HDM extract and sacrificed 24 h after the final challenge, pregated on CD45+ Lin− cells. Flow plots are representative of three independent experiments. (C) Quantification of β7Low and β7High MCs in mice challenged with saline ± HDM as in Fig. 1 B. Data from three independent experiments, n = 6–9 mice per group. *, P < 0.05 (t test); ns, not significant. (D) Representative flow plot showing composition of the MC compartment in the lungs of mice sensitized with 30 µg Alt on day 0, challenged twice with 3 µg Alt on days 9 and 10, and sacrificed 48 h after the final challenge. Flow plots are representative of three independent experiments. (E) Quantification of β7Low and β7High MCs in mice sensitized with either saline or 30 µg Alt and challenged twice with 3 µg Alt, as in Fig. 1 D. Data from three independent experiments, n = 6–9 mice per group. ***, P < 0.001 (t test). (F) Representative images of TB and CAE staining on β7Low airway MCs sorted from C57BL/6 mice following HDM challenge. Scale bar = 5 µm. (G) Representative images of TB staining for β7High airway MCs sorted from C57BL/6 mice following HDM challenge (multiple images shown to display heterogeneity). Scale bar = 5 µm. (H) Representative images of CAE staining for β7High MCs sorted from C57BL/6 mice following HDM challenge (multiple images shown to display heterogeneity). Scale bar = 5 µm. (I) Representative flow plots of airway MCs in littermate WT control or mMCP-5/DTA mice sensitized with either saline or 30 µg Alt, challenged twice with 3 µg Alt, and sacrificed 48 h after the final challenge. (J) Quantification of airway β7High and β7Low MCs in WT and Mcpt5/DTA mice relative to stromal cells in mice sensitized with either saline or 30 µg Alt and challenged twice with 3 µg Alt. Data from three independent experiments, n = 4–12 mice per group. *, P < 0.05 (t test).

