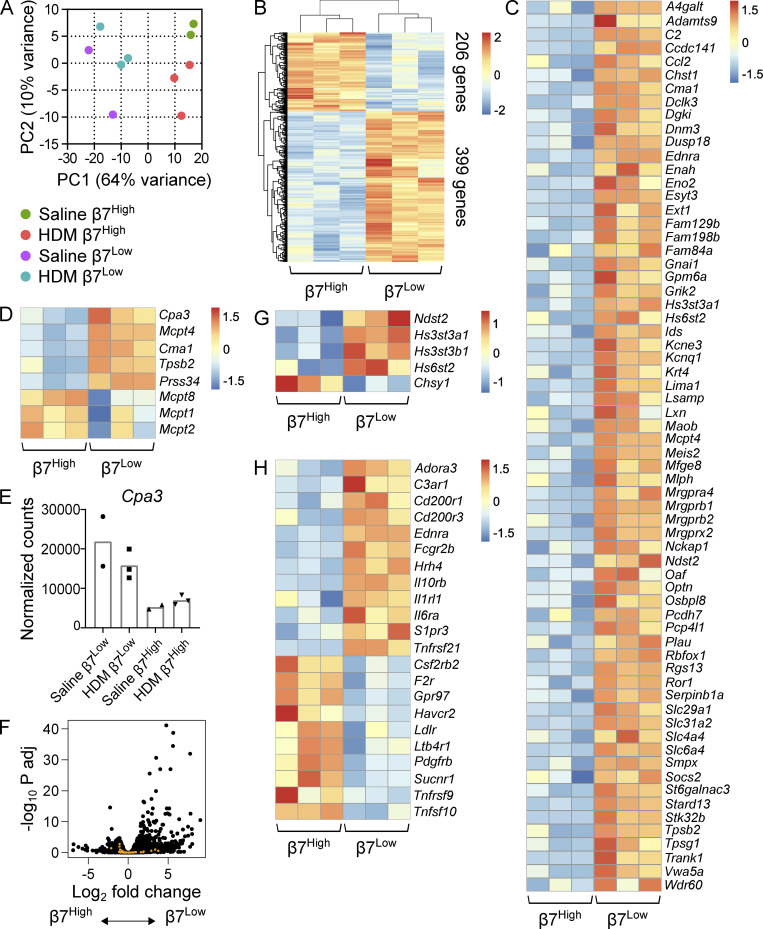
Figure 2.
β7High MCs are transcriptionally distinct from constitutive β7Low MCs. (A) Principal component plot of β7Low and β7High MCs sorted from the combined lung and trachea of mice challenged with either saline or 3 µg HDM extract twice per week for 3 wk and sacrificed 24 h after the final challenge. Percentages indicate the level of variance described by each component. Colored circles denote biological replicates (two to three per group), with each replicate consisting of cells pooled from three mice to minimize individual variability. Each replicate is the result of an independent experiment. (B) Heatmap showing all transcripts differentially expressed between β7Low and β7High MCs following repeated HDM challenge (FDR < 0.1, DESeq2). Each replicate is pooled from three mice and derived from an independent experiment; scale bar indicates z score. (C) Heatmap showing transcripts found in the ImmGen CTMC signature that were differentially expressed between β7Low and β7High MCs following HDM challenge (FDR < 0.1, DESeq2). Each replicate is pooled from three mice and derived from an independent experiment; scale bar indicates z score. (D) Heatmap showing differentially expressed MCPs in sorted β7Low and β7High subsets following HDM challenge (FDR < 0.1 with the exception of Mcpt1 and Mcpt2, DESeq2). Each replicate is pooled from three mice and derived from an independent experiment; scale bar indicates z score. (E) Normalized counts indicating Cpa3 expression in constitutive β7Low MCs and inducible β7High MCs. (F) Volcano plot of differential gene expression between β7High and β7Low MCs (black) with overlay of ImmGen basophil signature genes (orange). (G) Heatmap representation of differentially expressed glycose-aminoglycan biosynthetic enzymes in sorted β7Low and β7High subsets following HDM challenge (FDR < 0.1). Each replicate is pooled from three mice and derived from an independent experiment. (H) Heatmap indicating differentially expressed cell surface receptors in sorted β7Low and β7High subsets following HDM challenge (FDR < 0.1, DESeq2). Each replicate is pooled from three mice and derived from an independent experiment; scale bar indicates z score.

