Figure 3.
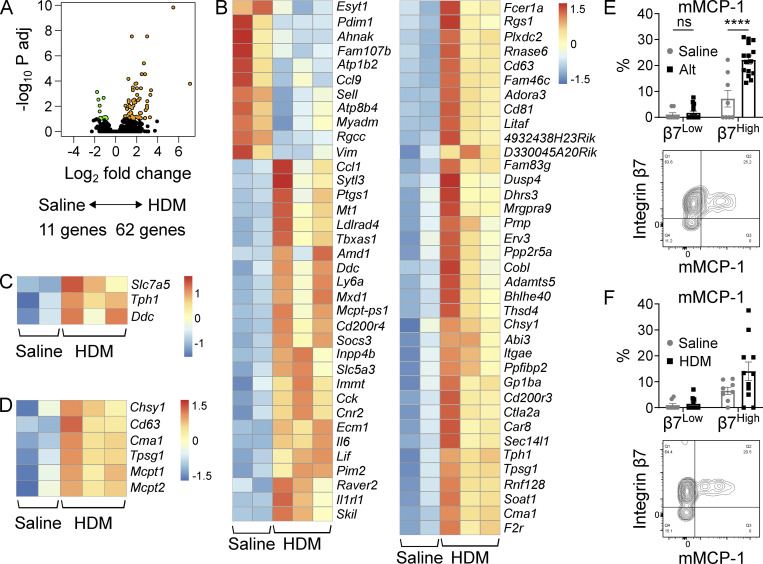
The β7High MC transcriptome dynamically changes in response to allergic inflammation. (A) Volcano plot indicating differentially expressed transcripts (FDR < 0.1) between β7High MCs isolated from the lungs of mice challenged twice per week for 3 wk with saline (n = 2) or HDM (n = 3). Transcripts highlighted in orange (62 genes) are enriched in MCs from HDM-challenged mice, and transcripts highlighted in green (11 genes) are enriched in MCs from saline-challenged mice. Adj, adjusted. (B) Heatmap showing differentially expressed transcripts between β7High MCs isolated from the lungs of mice challenged with saline or HDM (FDR < 0.1, DESeq2). Each replicate is pooled from three mice and derived from an independent experiment; scale bar indicates z score. (C) Heatmap showing differentially expressed serotonin biosynthetic components between β7High MCs isolated from the lungs of mice challenged with saline or HDM (FDR < 0.1, DESeq2). Each replicate is pooled from three mice and derived from an independent experiment; scale bar indicates z score. (D) Heatmap showing differentially expressed granule components and proteases between β7High MCs isolated from the lungs of mice challenged with saline or HDM (FDR < 0.1 with the exception of Mcpt1 and Mcpt2, DESeq2). Each replicate is pooled from three mice and derived from an independent experiment; scale bar indicates z score. (E) Quantification of mMCP-1 expression in β7Low and β7High airway MCs following sensitization with saline or 30 µg Alt on day 0 and challenge with 30 µg Alt on days 9 and 10, sacrificed 48 h after the final challenge (top), with representative flow plot (bottom). Data from three independent experiments, n = 8–15 mice per group. ****, P < 0.0001 (t test); ns, not significant. (F) Quantification of mMCP-1 expression in β7Low and β7High airway MCs following challenge with saline or 10 µg HDM twice per week for 3 wk (top) with representative flow plot (bottom). Data from four independent experiments, n = 8–11 mice per group. ns, not significant (t test).

