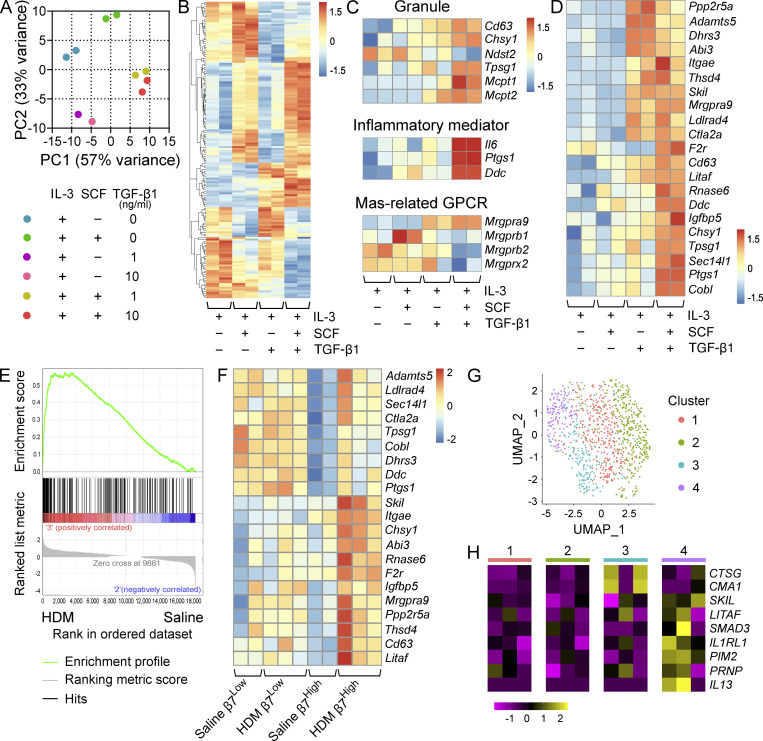
Figure 6.
TGF-β signaling induces a MMC-like transcriptional profile in BMMCs. (A) PCA of BMMCs grown and maintained in IL-3 and treated with SCF alone, TGF-β1 alone, or SCF in combination with TGF-β1 at the indicated concentrations for 72 h. Replicates are from two independent experiments with separate donors. (B) Heatmap showing the 100 most variable genes in BMMCs grown and maintained in IL-3 and treated with SCF alone, TGF-β1 alone, or SCF in combination with TGF-β1 at 10 ng/ml. All transcripts are significantly differentially expressed, with an FDR < 0.1 (DESeq2). Columns indicate biological replicates from two independent experiments (red, high; blue, low). (C) Heatmap analysis of MC granule-associated proteins and proteases (top) inflammatory mediator transcripts (middle) and MRGPR-family genes (bottom) differentially expressed (FDR < 0.1, DESeq2) between BMMCs grown and maintained in IL-3 and treated with SCF or SCF in combination with TGF-β1 at 10 ng/ml. Samples maintained in IL-3 alone or treated with TGF-β1 alone are shown for reference. Columns indicate biological replicates from two independent experiments (red, high; blue, low). (D) Heatmap analysis of transcripts significantly up-regulated in β7High MCs from HDM-challenged mice relative to saline treatment (FDR < 0.1, DESeq2) expressed by BMMCs grown and maintained in IL-3 and treated with SCF or SCF in combination with TGF-β1 at 10 ng/ml. Columns indicate biological replicates from two independent experiments (red, high; blue, low). Samples maintained in IL-3 alone or treated with TGF-β1 alone are shown for reference. (E) Gene set enrichment analysis plot evaluating β7High MCs from HDM-challenged versus saline-challenged mice for a set of transcripts significantly up-regulated in BMMCs treated with SCF and TGF-β1 relative to SCF alone (FDR < 0.1, DESeq2). P = 0 (below the lower limit of reporting for gene set enrichment analysis). (F) Heatmap analysis of TGF-β-target transcripts identified in D in β7High and β7Low MCs from saline or HDM-challenged mice. All transcripts are significantly up-regulated in β7High MCs (FDR < 0.1, DESeq2), while none show significant changes in β7Low MCs. Columns indicate biological replicates from two independent experiments (red, high; blue, low). (G) Uniform manifold approximation and projection embedding of human distal lung MCs computationally pooled from three healthy donors, identifying four clusters of distal lung MCs. (H) Heatmap showing expression of MCTC-associated transcripts significantly enriched (Wilcoxon test) in cluster 3 (blue; CTSG: FDR < 3 × 10−79, CMA1: FDR < 7 × 10⁻¹⁵); select TGF-β–induced transcripts enriched in cluster 4 (purple; LITAF: FDR < 2 × 10⁻⁸, SKIL: P < 0.001, SMAD3: FDR < 5.2 × 10⁻⁵); transcripts up-regulated in murine β7High MCs enriched in cluster 4 (purple) in relation to all other clusters (IL1RL1: FDR < 2 × 10⁻¹⁴, PIM2: P < 5 × 10⁻⁵, PRNP: P < 10−6); and IL13, which although not statistically significant is presented because expression was not detected outside of cluster 4. Columns indicate average expression levels for each individual donor.

