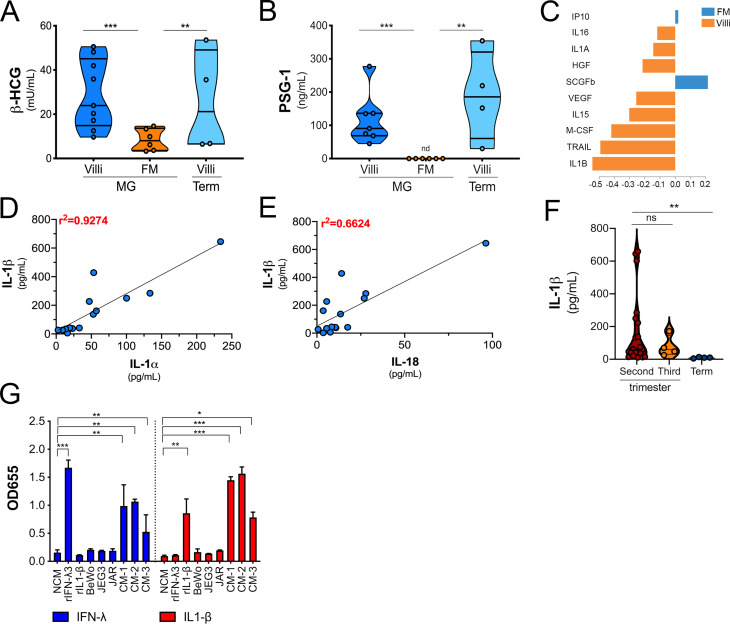
Figure S1.
βhCG and PSG-1 secretion in CM from chorionic villi and FM preparations and the difference in cytokine abundance after sPLS-DA. (A and B) Luminex assays for β-hCG (A) or ELISA for PSG-1 (B) in CM derived from midgestation (MG) or full-term (Term) chorionic villi (Villi) or FM. Data are shown as mU/ml (A) or ng/ml (B). (C) The variable importance plot derived from sPLS-DA represents the contribution of each cytokine selected on the first component, with length of the bar representing the importance of each cytokine to the component (importance from bottom to top). Colors indicate the samples from villi- and FM-derived CM in which the cytokine is most abundant. (D and E) Correlation analyses for IL-1β levels in villi-derived CM relative to the levels of IL-1α (D) or IL-18 (E). Correlation coefficients are shown in red at top left. (F) IL-1β levels in CM isolated from chorionic villi in the second or third trimesters and at term. Each symbol represents villi from unique placental preparations. (G) Secreted alkaline phosphatase activity (shown as OD655) in the medium of HEK293 reporter cells stably expressing IL-1R (in red) or the receptor for IFN-λs (in blue) and treated with recombinant IFN-λ3 (100 µg/ml) or IL-1β (100 µg/ml) or with CM from choriocarcinoma cell lines (BeWo, JEG3, and JAR) or with CM from three placental preparations of villi-derived CM. In A and B, individual villi or FM preparations are indicated by symbols. Data in G are shown as mean ± SD of three independent experiments. Significance in F was determined with the Kruskal-Wallis test. **, P < 0.01. Significance in G was determined with one-way ANOVA with Dunnett’s test for multiple comparisons compared with NCM-treated controls. *, P < 0.05; **, P < 0.01; ***, P < 0.001.

