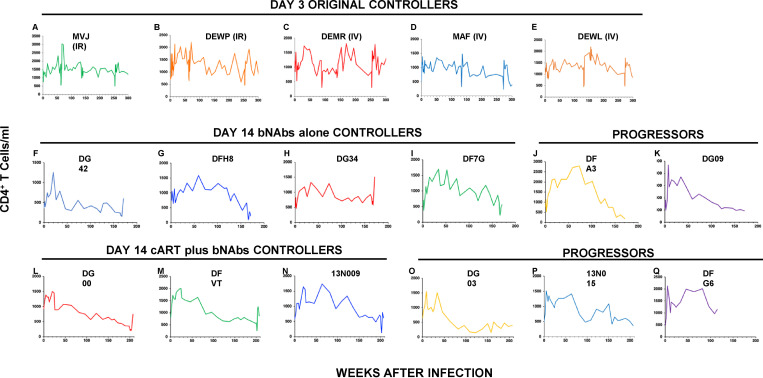
Figure S1.
CD4+ T cell levels in macaques treated with bNAbs alone or cART plus bNAbs. (A–Q) Absolute numbers of circulating CD4+ T cells in five controller macaques following bNAb therapy beginning on day 3 PI (A–E); in four controller (F–I) and two progressor (J and K) macaques following bNAb therapy alone beginning at week 2 PI; and in three controller (L–N) and three progressor (O–Q) macaques after cART plus bNAb therapy beginning at week 2 PI are shown.

