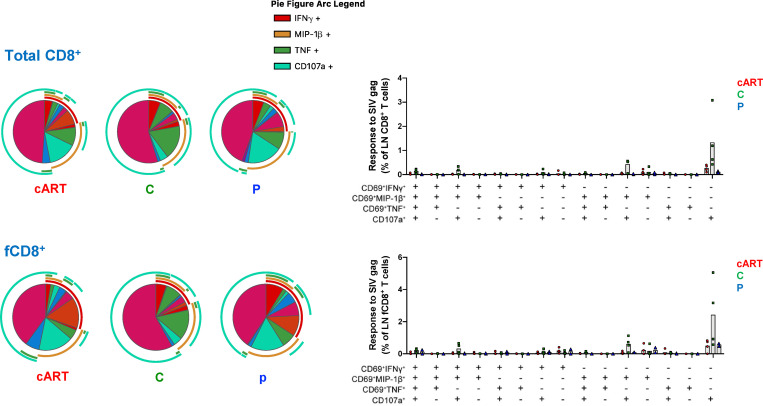
Figure S4.
Polyfunctional profile of bulk CD8+ and follicular CXCR5+ CD8+ T cell responses to SIV Gag in the LNs of day 3 controller, progressor, and cART-only monkeys. The pie charts and graphs show the mean frequency of cells performing all different combinations of effector functions. Graphs also show the individual data points. C, controller macaques; P, progressor macaques.

