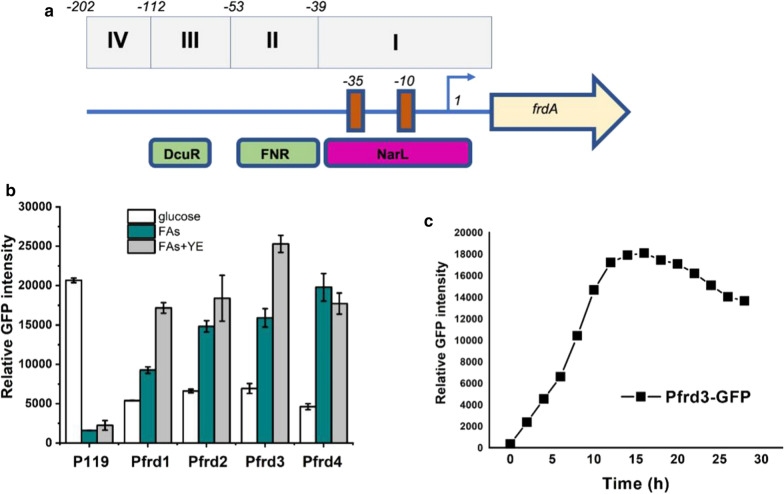
Fig. 5.
Screening FAs response promoters. a Length of truncations of the native frdA promoter. Symbols are grey filled rectangle: four truncated promoters; red filled rectangle: -10 region and -35 region of frdA gene; yellow rightwards arrow: frdA gene. b Comparison of the relative GFP intensity of different truncated promoters under different substrates. Growth in the M9 medium containing different carbon sources (1% glucose, 1%FA, 1% FAs A and 0.03% yeast extract) for 24 h. The control for these experiments was P119. c The relative GFP intensity of the Pfrd3 promoter at different times. Growth in the M9 medium containing 1% FAs and 0.03% yeast extract

