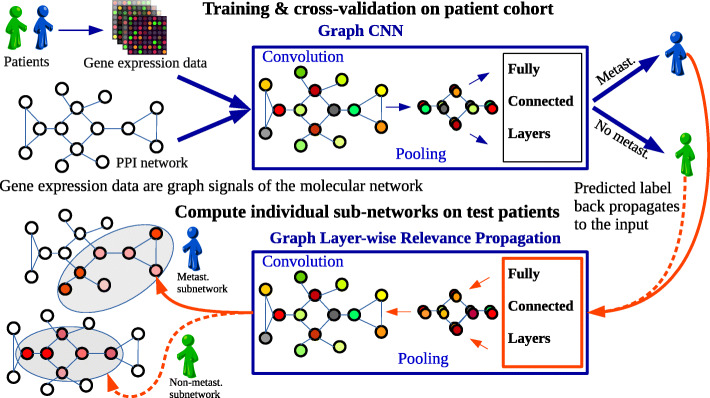
Fig. 1.
The workflow to obtain a data point-specific subnetwork. For clarity, a data point represented by a gene expression profile of a patient from the breast cancer dataset. The molecular network (HPRD PPI) structures the genes and is the same for every patient. Patient’s gene-expression values are assigned to every vertex of the HPRD PPI so that the patient is represented as a graph signal. Trained Graph-CNN performs graph convolutions and as output classifies the patient as metastatic or non-metastatic. GLRP is applied as a post hoc processing, propagating the relevance from the predicted label up to the input features (vertices of the molecular network). Top 140 highly relevant vertices constitute a molecular subnetwork. Molecular subnetworks differ from one patient to another

