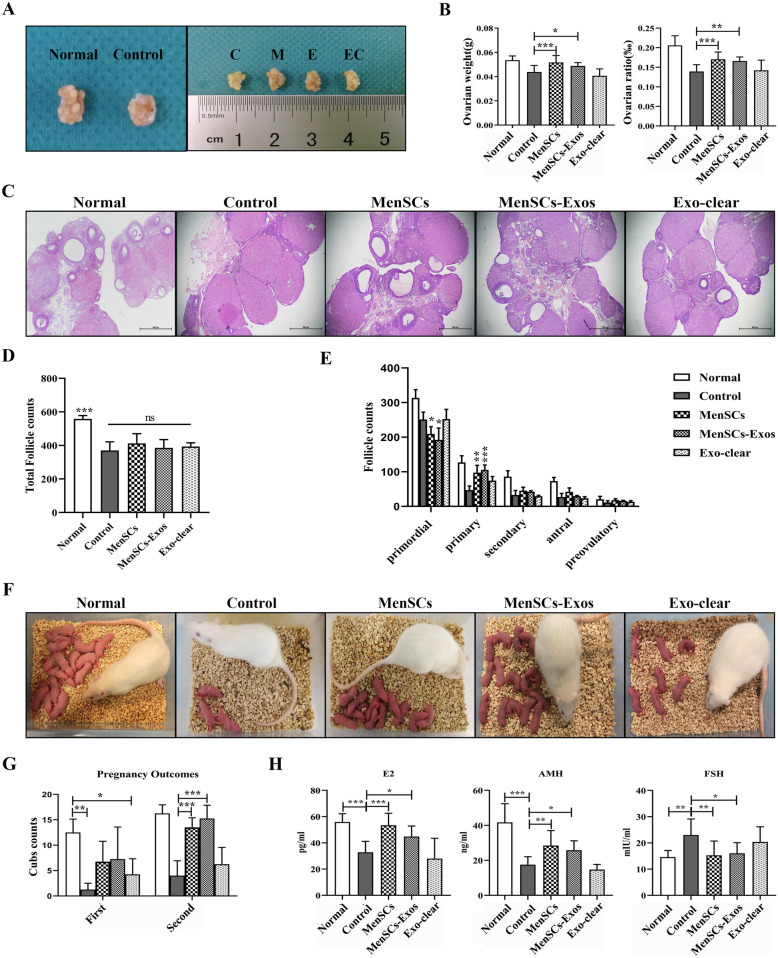
Fig. 6.
Ovarian morphological, ELISA assays, and live birth outcomes after treatments. a Representative ovarian morphology ((C) control group, (M) MenSCs group, (E) MenSCs-Exos group, (EC) Exo-clear group). b Ovarian weight (left) and ovarian/body weight ratio (right). c H&E staining of ovarian sections (× 40). d Total follicle counts. e Counting of follicles at different stages. f Live births photos of normal rats and four treatment groups. g Live births counts. h Serum levels for E2 (left), AMH (middle), and FSH (right) (n = 8). Data were represented as mean ± SD, *p < 0.05, **p < 0.01, ***p < 0.001

