Figure 2.
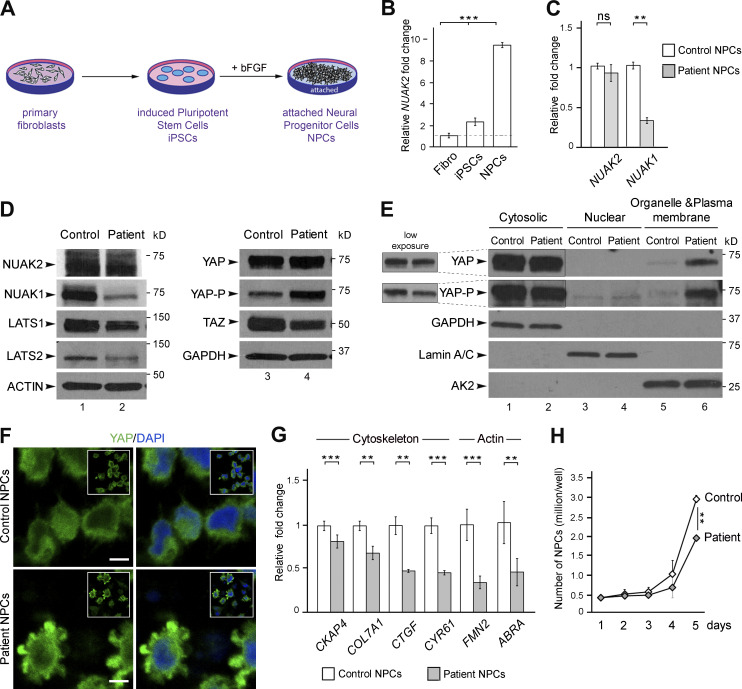
NUAK2 mutation affects Hippo-YAP signaling in patient NPCs. (A) Schematic representation of the different cell types generated from control and fetus III-3 skin biopsies. (B) Q-PCR showed higher level of NUAK2 transcripts in control NPCs compared with fibroblasts and iPSCs. Relative NUAK2 expression was normalized against the values for fibroblasts and set to 1 (indicated by a dashed line). (C) Q-PCR showed that while NUAK2 expression was unchanged in patient NPCs compared with control, transcript level of its paralog NUAK1 was significantly reduced. Relative NUAK2 and NUAK1 expression was normalized against the values for control NPCs and set to 1. Q-PCR was repeated in three independent experiments, using two sets of primers. (D) Western blot confirmed similar level of endogenous NUAK2, while NUAK1 was strikingly reduced in patient cells compared with control. LATS1 and LATS2 were reduced in patient cells compared with control, with more extent for LATS1. Phosphorylation of YAP (YAP-P), the main downstream effector of LATS1/2, was significantly increased in patient cells, while YAP level remained the same. TAZ, a paralog of YAP, was significantly decreased in patient cells compared with control. Protein extracts were performed on two control NPC clones and two patient NPC clones. For each NPC clone, at least three biological samples were revealed by Western blot. The same control and patient protein extracts were loaded on two 4–20% gels and revealed with different antibodies as shown in the figure. (E) Subcellular protein fractionation showed increased cytoplasmic localization of YAP in patient cells compared with control, especially in organelle and plasma membranes. Three independent fractionations were performed. (F) YAP immunofluorescence revealed increased level of YAP in the cytoplasm of mutant NPC compared with control. Two antibodies, mouse anti-YAP (Santa Cruz) and rabbit anti-YAP (Cell Signaling) gave the same result. Scale bar = 5 µm. (G) Q-PCR analysis of well-known YAP target genes showed significant reduction of YAP transcriptional activity in patient NPCs compared with control. All YAP targets encode proteins that control the cytoskeleton network including actin. For each gene, relative expression was normalized against the value for control NPCs and set to 1. Q-PCR was repeated at in two independent experiments. (H) Live-cell counting over 5 d in culture showed slower growth of NUAK2-mutated NPCs compared with control. Cells were harvested from three wells (of a 12-well plate). The values shown are the average ± SD of three technical replicates. **, P < 0.02; ***, P < 0.005; ns, not significant.

