Figure 3.
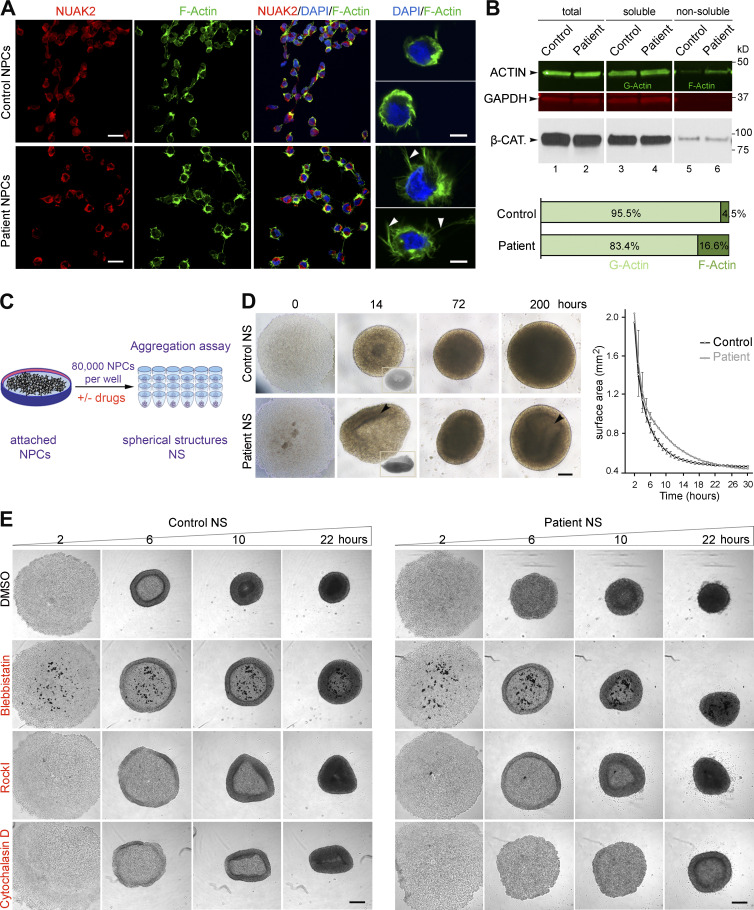
Defects in the actomyosin network in patient-derived NPCs cause abnormal cell aggregation. (A) Immunofluorescence on NPCs revealed close proximity of NUAK2 to F-actin as well as F-actin network expansion in patient NPCs compared with control (left panels). Scale bar = 20 µm. Higher-resolution images of representative cells showed that patient NPCs were enlarged and enriched with F-actin filopodial protrusions (arrowhead) compared with control cells (right panel). Scale bar = 5 µm. (B) G- and F-actin fractionation followed by quantitative Western blot showed increased F-actin in patient NPCs compared with control. GAPDH and β-CATENIN (β-CAT) served as loading controls for each protein fraction. Two independent fractionations were performed. (C) Schematic representation of aggregation assay, in which 80,000 NPCs seeded in low-attachment U-bottom microwells formed spherical structures (NS) over time. (D) Bright-field images illustrating representative spatiotemporal assembly and organization of NPCs during aggregation assay. Patient NPC aggregation was disorganized, failing to form donut-shaped pattern (14 h, inset) and spherical structures compared with control. Heterogeneous cell density (arrowhead) was observed in patient NS compared with control, suggesting lower proliferation. Scale bar = 200 µm. NS area measurement at sequential time points showed that patient NS aggregation was delayed compared with control (right graph). All experiments were repeated three times, with two different iPSC-derived NPC clones for control and patient. Surface area was calculated using ImageJ software, and represented values are the average ± SD of eight NS. (E) Bright-field images of NS after 2, 6, 10, and 22 h in culture, showing absence of outer ring formation in patient NPCs. Treatment with BLEB rescued ring formation in patient NPCs, as well as with ROCK-I, to a lesser extent. In contrast, treatment with cytochalasin D abrogated cell aggregation in both cell lines, more so in patient NPCs. All experiments were repeated independently three times. Scale bar = 250 µm.

