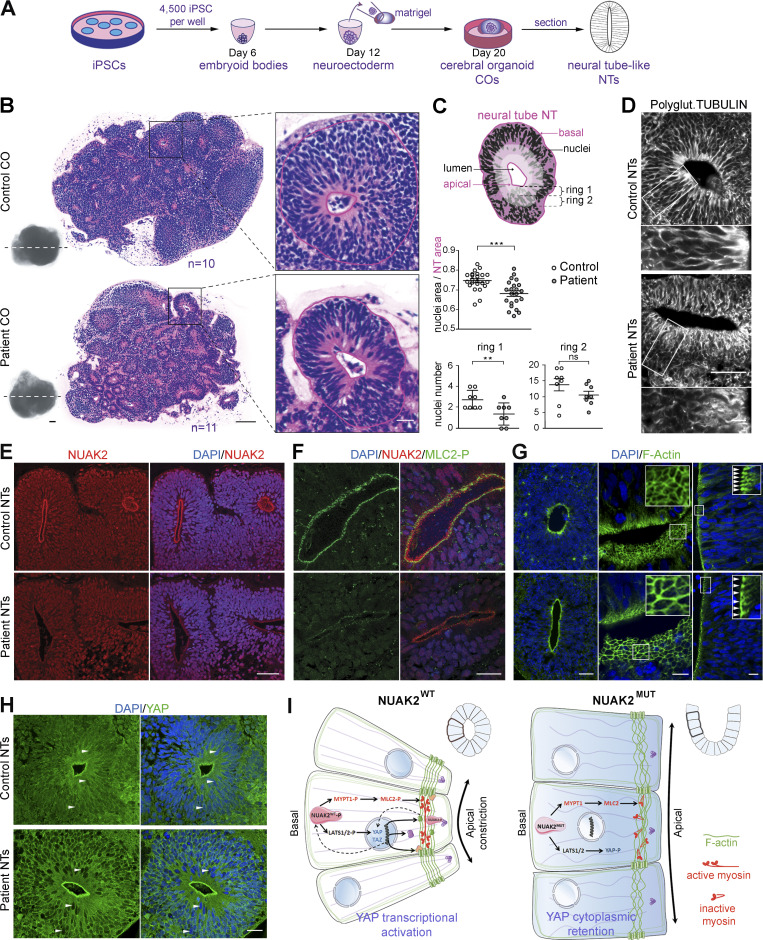
Figure 4.
NUAK2 controls apical actomyosin network in human COs. (A) Schematic representation of the culture workflow to generate COs from control and patient iPSCs. At 20 d, COs were fixed, sectioned, and used as a proxy to study NTs. Three batches of COs were independently performed using two control iPSC clones and two patient iPSC clones. For each iPSC clone, 8–16 COs were prepared (in 8–16 wells of a 96-well plate). (B) Representative image of H&E staining of control (n = 10) and patient (n = 11) CO sections shows multiple 2D NT structures that display features of the embryonic neural tube. Patient NT shows basal nucleus accumulation compared with control NT, in which nuclei were scattered along the apico-basal axis. Scale bars = 200, 100, and 20 µm (from left to right panels). (C) Schematic representation of a NT displaying total NT area (pink) and nucleus area (black), as well as two most apical subrings (rings 1 and 2, light pink). Ratio of nucleus area to NT area confirmed nucleus compaction in patient NT (n = 23) compared with control (n = 22; top graph). Number of nuclei was decreased apically (rings 1 and 2) in patient NT (n = 8) compared with control (n = 8; bottom graphs). (D) Polyglutaminated tubulin immunostaining on CO sections revealed disorganized and nonlinear microtubule network in mutant NT cells compared with control. Scale bars = 50 µm (top panel); 10 µm (lower panel). (E) Representative image of NUAK2 immunostaining on CO sections showing that, while NUAK2 localized in the nucleus of NECs, its apical concentration was significantly reduced in mutant NT compared with control. Scale bar = 50 µm. (F) Representative image of coimmunostaining of NUAK2 with phosphorylated MLC2 (MLC2-P) on CO sections, showing their proximal localization at the apical side of NT cells, with less extent in mutant NT. Scale bar = 20 µm. (G) Representative image of phalloidin staining revealing F-actin accumulation apically (left panel). Apical view of mutant NT revealed enlargement of NECs compared with control (middle panel, inset). Frontal view of patient NT confirmed enlargement of NECs compared with control (right panel, inset, white arrowheads). Scale bars = 50, 10, and 10 µm (from left to right panels). (H) Representative image of YAP immunostaining on CO sections revealing YAP cytoplasmic concentration in mutant NT cells compared with control. We also noted enrichment of YAP apically in both patient and control NTs, suggesting a possible interaction of NUAK2 and the actomyosin network during apical constriction. Scale bar = 20 µm. (I) Model showing the role of NUAK2 in regulating apical cell constriction and apicobasal cell elongation during neural tube formation. By regulating Hippo-YAP signaling, NUAK2 controls F-actin organization and dynamics. All immunostaining were confirmed at least three times using COs from different batches. **, P < 0.02; ***, P < 0.005; ns, not significant.

