Figure S3.
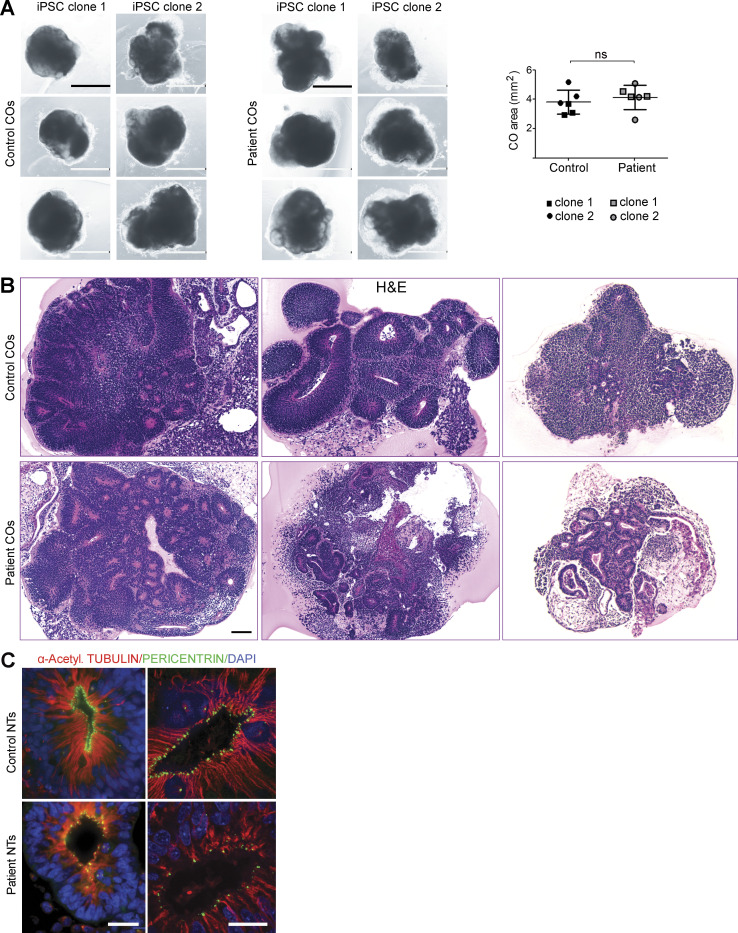
NUAK2 controls NT-like structures in human COs. (A) Images of control and patient COs derived from two different iPSC clones. Graph representing the size (area) of control and mutant COs (right panel). Scale bar = 1 mm. (B) H&E staining of CO sections revealed either general dysplasia with significantly fewer NT structures or nucleus disorganization in patient NT compared with control. Scale bar = 100 µm. (C) Coimmunostaining using α-acetylated tubulin and pericentrin confirmed microtubule disorganization and scattered centrosomes in NUAK2 mutant NECs compared with control. Scale bar = 20 µm. ns, not significant.

