Figure 1.
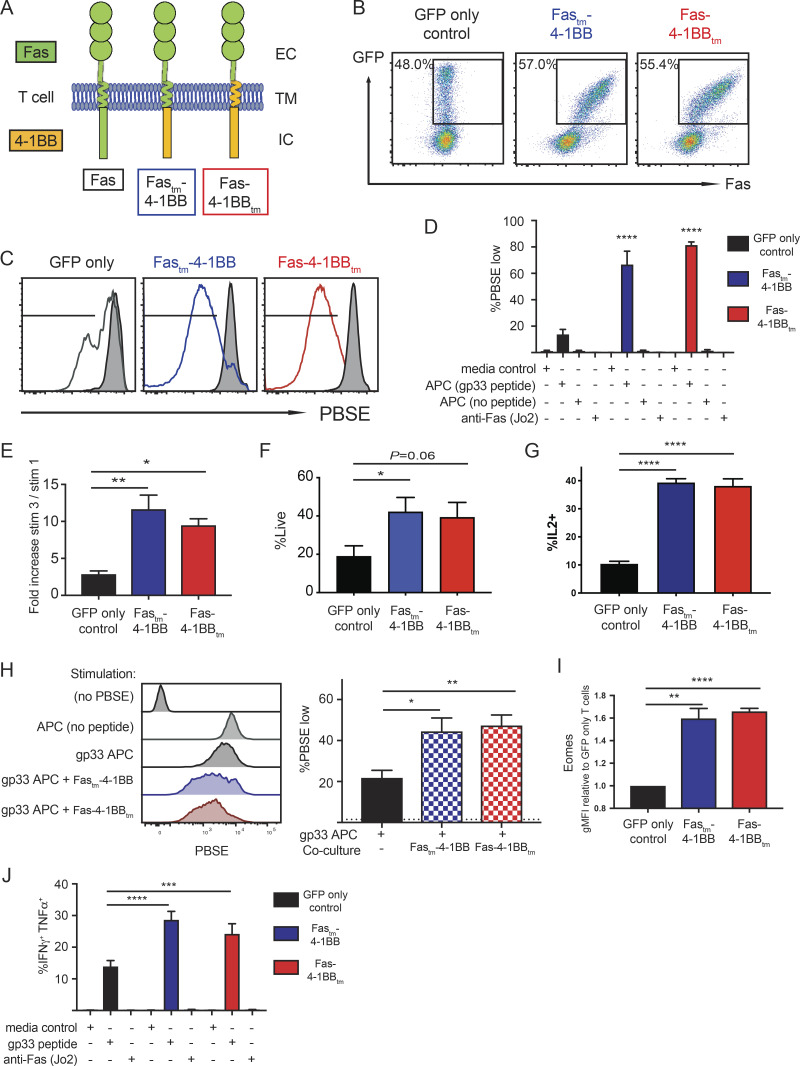
Fas-4-1BB IFPs enhance proliferation and cytokine production of engineered T cells. Splenocytes from naive P14 mice were stimulated with anti-CD3/CD28 antibodies and then transduced with retroviral supernatant. 7 d later, T cells were expanded by restimulation with peptideMsln-pulsed irradiated splenocytes; this was repeated 7 d later. T cells were used for assays 5–7 d later. (A) Schematic representation of Fas-4-1BB IFP constructs. EC, extracellular; TM, transmembrane; IC, intracellular. (B) Expression of Fas on T cells transduced with GFP alone or Fas-4-1BB/GFP constructs, detected by flow cytometry. (C) Proliferation of engineered GFP T cells 7 d after stimulation with peptidegp33-pulsed splenocytes (1 µg/ml) relative to unstimulated T cells (gray). (D) Quantification of PBSE dilution in engineered GFP T cells 7 d after stimulation, as indicated. (E) Enrichment of transduced T cells in a mixed population of non- and transduced T cells. (F) Viability of GFP cells after three stimulations as determined by flow cytometry. (G) Proportion of T cells that exhibit intracellular IL-2 production after peptidegp33 stimulation (1 µg/ml) for 5 h, assessed by flow cytometry. (H) Representative histogram and quantification of PBSE dilution in GFP-only control T cells 7 d after stimulation, as indicated, and co-culture with Fastm-4-1BB cells (blue) or Fas-4-1BBtm (red) P14 T cells. (I) Expression of Eomes in engineered T cells as detected by intracellular antibody staining and flow cytometry. gMFI, geometric MFI. (J) Effector cytokine production of engineered T cells after culture with media-only control, peptidegp33 (1 µg/ml), or anti-Fas antibody (200 ng/ml) stimulation for 5 h, followed by intracellular cytokine flow cytometry. Data are representative of four (B) or three (C) experiments, or represent the mean of three (D, I, and J), four (E), seven (F), six (G), or two (H) experiments. *, P < 0.05; **, P < 0.01; ***, P < 0.001; ****, P < 0.0001 by one-way ANOVA for multiple comparisons (D, H, and J) or t test compared with GFP-only control T cells (E–G and I). Error bars indicate SEM.

