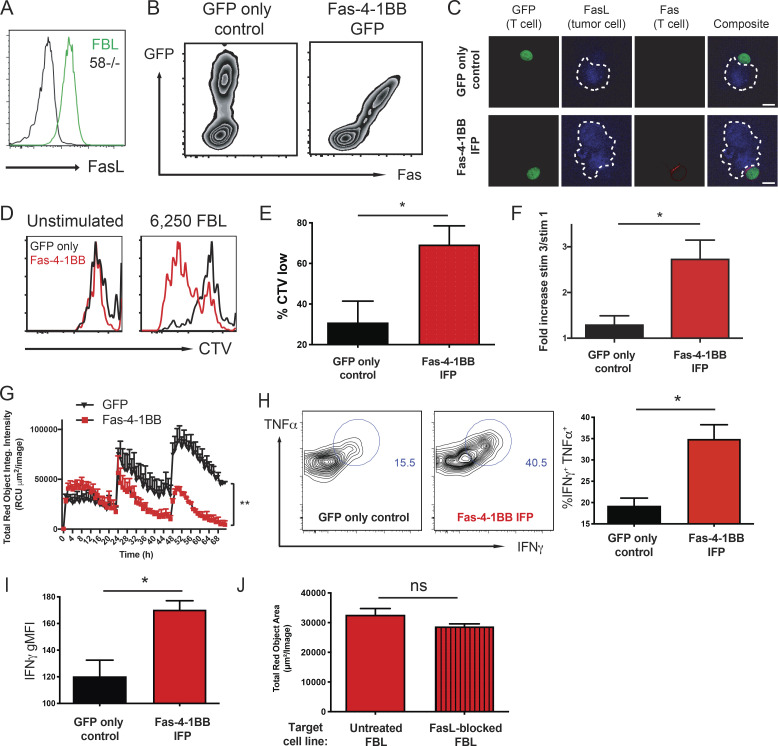
Figure 2.
Fas-4-1BB expression enhances function of transduced T cells. Splenocytes from naive TCRgag mice were transduced, restimulated once with irradiated FBL and splenocytes, and assayed 5–7 d later. (A) Expression of FasL in FBL and 58−/− murine cell lines as detected by flow cytometry. (B) Transgenic expression of Fas on engineered T cells as detected by flow cytometry for GFP and anti-Fas antibodies. (C) Visualization of Fas-4-1BB localization within T cell–FBL conjugates. Engineered T cells were co-cultured with FBL at a 10:1 ratio, and conjugates were imaged by confocal microscopy. Scale bars indicate 10 µm. (D) Proliferation of Fas-4-1BB (red) and GFP empty vector control (black) T cells (100,000 cells) as measured by cell trace violet (CTV) dilution without or after stimulation with 6,250 FBL for 7 d. (E) Quantification of CTV dilution of Fas-4-1BB T cells (representative in D) relative to CTV dilution of GFP empty vector control T cells. (F) Enrichment of transduced T cells in a mixed population that also included nontransduced TCRgag T cells after two weekly cycles of restimulation with irradiated FBL and splenocytes. (G) IncuCyte SKO assay. NucLight Red+ FBL were co-cultured with GFP control (black) or Fas-4-1BB (red) T cells at a 3:1 ratio (104 FBL). 104 FBL were added every 24 h, and tumor cell lysis was quantified by Total Red Object Integrated Intensity (red calibrated unit [RCU] μm2/image). (H) Cytokine production of T cells after SKO assay. T cells were restimulated with FBL (1:1) for 5 h, fixed, permeabilized, stained for intracellular cytokines, and assessed by flow cytometry. (I) Geometric MFI (gMFI) of IFNγ production in H. (J) NucLight Red+ FBL were untreated or treated with blocking anti-FasL antibody and used to stimulate Fas-4-1BB transduced T cells every 24 h for three stimulations. 24 h following the last stimulation, the remaining FBL were quantified by IncuCyte analysis. Data are representative of two (A, C, and G), five (B), or six (D) experiments or represent the mean of six (E) or three (F and H–J) experiments. ns, not significant; *, P < 0.05 by t test (E, F, and H–J) and at the final time point (G). Error bars indicate SEM.

