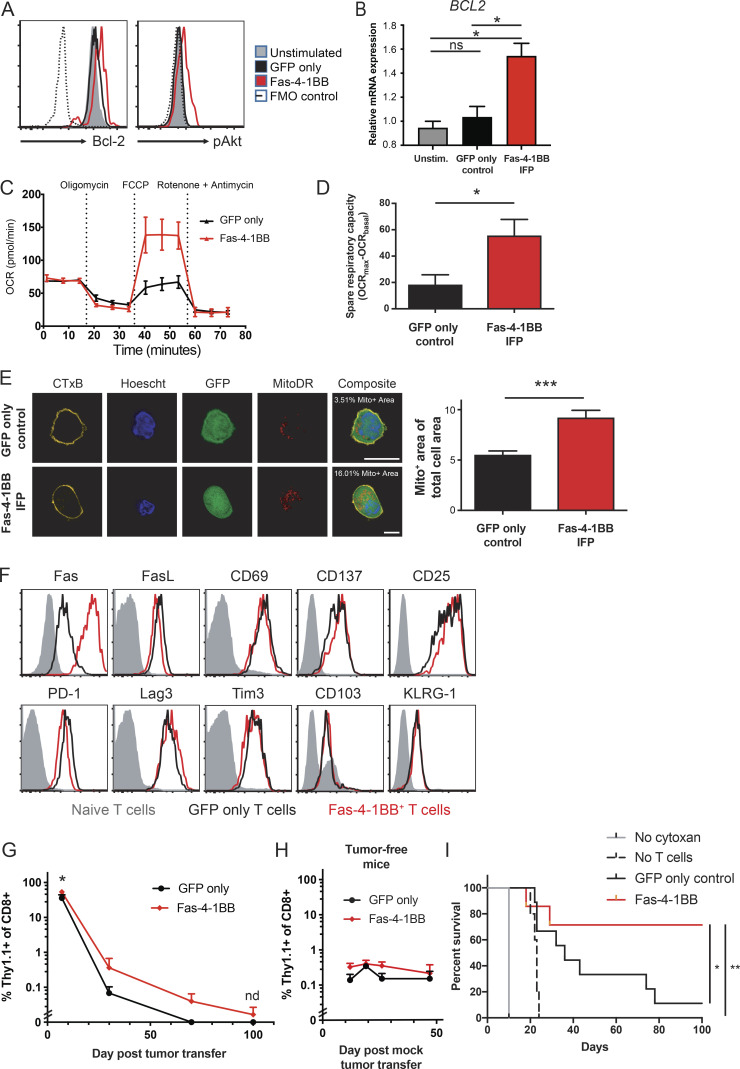
Figure 3.
Fas-4-1BB expression alters the phenotype of transduced T cells and improves ACT efficacy in a murine leukemia model. Transduced TCRgag T cells were generated as described in Fig. 2. (A) Expression of anti-apoptotic and cell growth/survival factors in engineered T cells. Transduced T cells were incubated overnight with FBL tumor cells at a 1:1 ratio and then were fixed, permeabilized, and stained for intracellular pAKT and Bcl-2. FMO, fluorescence minus one. (B) Quantitative PCR of BCL2. GFP control and Fas-4-1BB T cells were FACS isolated and relative expression determined with the qPCR SYBR Green Assay and analyzed by the ΔΔCT method. (C) Metabolic profile of engineered T cells. Twice-restimulated T cells were assessed for OCR under basal metabolic conditions and in response to mitochondrial inhibitors. A representative OCR trace of GFP-only control (black) or Fas-4-1BB (red) T cells is shown. (D) Cumulative spare respiratory capacity of T cells as in panel C. (E) Quantification of the percentage of cell area occupied by mitochondria. Confocal images of engineered GFP+ (green) T cells stained with CTxB (yellow), Hoechst (blue), and MitoDR (red; n = 19–20 independent images per group). Scale bars indicate 10 µm. (F) Phenotype of transduced, twice-stimulated T cells on day of injection. (G–I) B6 mice were injected with 4 × 10⁶ FBL cells or mock injected (I). 5 d later, mice were treated with Cy and a cohort received 106 GFP-only control or Fas-4-1BB T cells i.p. (G) Persistence of tumor-specific T cells in surviving FBL-bearing mice that received GFP-only control (n = 9) or Fas-4-1BB (n = 7) T cells. Mice were bled at days 12, 30, 70, and 100 after tumor transfer and transferred T cells detected by congenic marker expression as assessed by flow cytometry. (H) Persistence of tumor-specific T cells in tumor-free mice. Mice were bled at days 12, 19, 26, and 47 after tumor transfer. Transferred T cells were detected by congenic marker expression as assessed by flow cytometry (n = 4/group). (I) Survival of FBL-bearing mice that received no treatment (n = 1), Cy only (n = 10), or Cy plus GFP control (n = 9) or Fas-4-1BB (n = 7) T cells. Data are representative of two (A), three (F), four (C), or one (H) experiment or represent the mean of three (B), two (E, G, and I), or four (D) experiments. ns, not significant; *, P < 0.05; **, P < 0.01; ***, P < 0.001 by t test (B and D) and at each time point (G and H), or by log-rank Mantel-Cox test (I). Statistics not done if n < 3/group. Error bars indicate SEM.

