Figure 4.
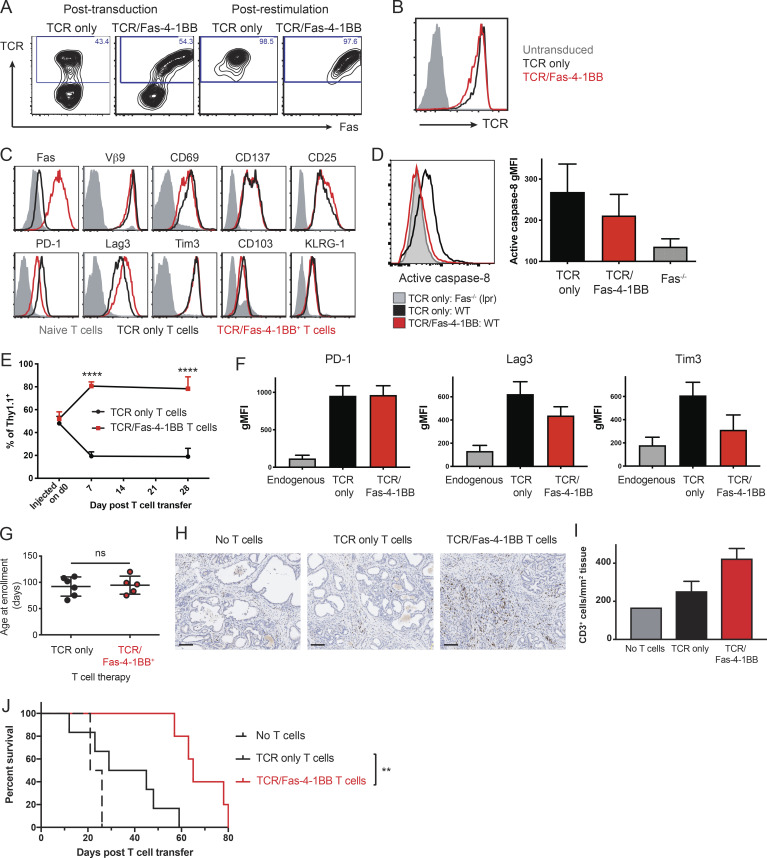
Fas-4-1BB T cells preferentially accumulate in the tumor and significantly improve survival in the KPC pancreatic cancer model. Splenocytes from P14 mice were transduced and restimulated/expanded with irradiated peptideMsln-pulsed splenocytes. T cells were assayed 5–7 d after the last stimulation. (A) T cell expression of Fas and TCRMsln, as detected by Vβ9 staining and flow cytometry. (B) Expression of TCRMsln as detected by Vβ9 expression in transduced T cells after restimulation relative to untransduced T cells (gray). (C) The expression of surface molecules on TCRMsln (black) and TCRMsln/Fas-4-1BB (red) T cells 5 d after restimulation compared with unstimulated T cells (gray). (D) Expression of activated caspase-8 in engineered T cells. T cells were stained 7 d after restimulation with the Vybrant FAM Caspase-8 Assay Kit (ThermoFisher) and analyzed by flow cytometry (differences with IFP did not reach statistical significance). gMFI, geometric MFI. (E–J) Weekly high-resolution ultrasound screening of KPC mice was initiated at 8 wk of age, and mice were enrolled in the study following detection of a pancreatic tumor with a minimum diameter of 3 mm. Mice were treated with a combination therapy of Cy (before first infusion only), T cell infusion, and tumor antigen vaccination (peptideMsln-pulsed irradiated splenocytes). (E) Preferential accumulation of Fas-4-1BB T cells in tumor tissue. Congenically distinct TCRMsln (black) and TCRMsln/Fas-4-1BB (red) T cells (Thy1.1+/+ and Thy1.1+/−, respectively) were combined at a 1:1 ratio (5 × 10⁶ each) and transferred to KPC mice. 7 d and 28 d after a single infusion, pancreas TIL were assessed by flow cytometry (day 7, n = 3; day 28, n = 4). (F) Phenotype of transferred T cells at day 28 in E relative to endogenous T cells in tumor (n = 4/group; TCR/Fas-4-1BB versus TCR only, P = not significant for all markers). (G) Age of enrollment in a survival study. Mice were randomly assigned to treatment groups of TCRMsln (black, n = 6) or TCRMsln/Fas-4-1BB (red, n = 5) T cell therapy. (H) IHC for CD3+ cells in pancreas from mice that received the indicated therapy every 2 wk for a total of three infusions, with Cy administered before the first infusion only. Mice were euthanized following signs of morbidity. Scale bars indicate 100 µm. (I) As in H, quantification of CD3+ cells in tumor tissue from mice that received no T cells (n = 1), TCRMsln-only T cells (n = 2), or TCRMsln/Fas-4-1BB T cells (n = 3). (J) Survival of KPC mice that received Cy and peptideMsln-pulsed splenocytes and either no ACT (dashed, n = 2), TCRMsln (black, n = 6), or TCRMsln/Fas-4-1BB (red, n = 5) ACT. Mice received infusions every 2 wk for a total of three infusions, with Cy administered before the first infusion only. Data are representative of three (A and B) or two (C and H) experiments or represent the mean of two to five (D–G, I, and J) experiments. ns, not significant; **, P < 0.01; ****, P < 0.0001 by t test (D, F, and G) and at each time point (E), or by log-rank Mantel-Cox test (J). Error bars indicate SEM.

