Figure S5.
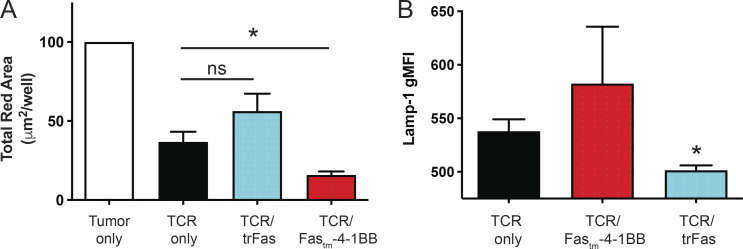
IncuCyte assay. (A) NucLight Red+ Panc1 cells were cultured alone (white) or co-cultured with TCR-only (black), TCR/trFas (blue), or TCR/Fas-4-1BB (red) T cells at a 30:1 E:T ratio. Tumor cell concentration was determined by Total Red Area (µm2/image). Averaged data represent T cells generated from three unique human donors. Statistical analyses are shown: TCR/Fastm-4-1BB versus TCR only, *, P< 0.05; TCR/trFastm-4-1BB versus TCR only, P = not significant; t test of final time point. (B) Lamp-1 (CD107a) expression of T cells previously exposed to tumor. T cells previously stimulated in the IncuCyte assay (as in A) were restimulated with Panc1 cells for 5 h and then stained for surface and intracellular Lamp-1 (CD107a) before evaluation by flow cytometry. Averaged data represent T cells generated from three unique human donors. TCR only versus TCR/trFas: *, P< 0.05; TCR only versus TCR/Fastm-4-1BB: P= not significant; t test. gMFI, geometric MFI.

