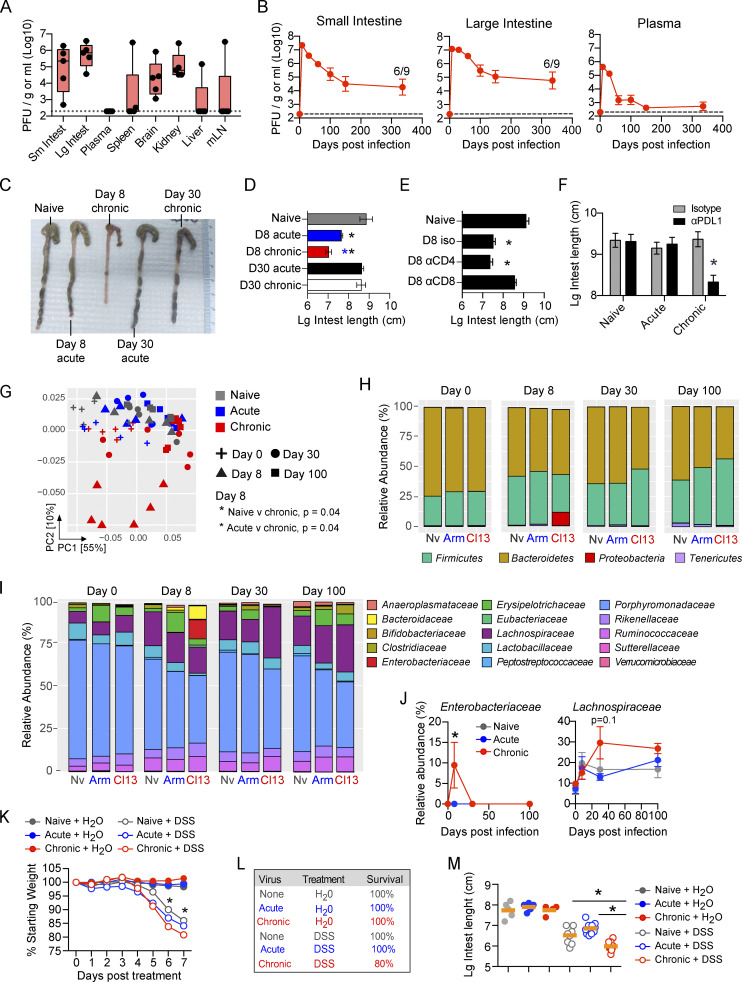
Figure 1.
The GIT is a long-lived reservoir of LCMV-Cl13 infection, which causes dysbiosis and increased susceptibility to colitis. (A) Mice were infected with LCMV-Cl13, and 150 dpi, PFUs of virus per gram of tissue or per milliliter of blood plasma were determined. mLN, mesenteric lymph node. n = 5 mice per group from one of two independent experiments. (B) Time course of LCMV-Cl13 titers in the SI, the LI, and blood plasma. Numbers on the graph indicate the number of mice with detectable virus at 336 dpi. n = 5–10 mice per time point from two independent experiments. *, P < 0.05, ANOVA test. (C and D) Representative pictures (C) and graphs (D) show LI length of naive, LCMV-Arm–infected (acute), and LCMV-Cl13–infected (chronic) mice at 8 and 30 dpi. Black asterisk, P < 0.05 naive versus day 8 chronic, ANOVA test; blue asterisk, P < 0.05 day 8 acute versus day 8 chronic, ANOVA test. n = 5–10 mice per group from two independent experiments. (E) Mice were left naive or infected with LCMV-Cl13 and treated every 2 d with CD4- or CD8-depleting antibodies. LI length was determined at 8 dpi. n = 5–10 mice per group from two independent experiments. *, P < 0.05, ANOVA test. (F) Mice were left naive or infected with LCMV-Arm or LCMV-Cl13 and treated with anti-PDL1 or isotype control antibodies beginning 25 dpi. The graph shows the LI length in isotype- or PDL1-treated mice after three treatments. n = 9–10 mice per group from two independent experiments. (G–I) 16S ribosomal RNA-seq was performed on the pellets of naive (Nv), LCMV-Arm–, and LCMV-Cl13–infected mice at 0, 8, 30, and 100 dpi. (G) PC analysis of β-diversity. By Adonis test naive versus day 8 chronic, P = 0.04; acute versus day 8 chronic, P = 0.04. Relative abundance of (H) bacterial phyla and (I) bacterial families merged by time and sample group. (J) Graphs show relative abundance of Enterobacteriaceae and Lachnospiraceae. *, P < 0.05, relative abundance means are significantly different from naive at this time point by ANOVA test. (G–I) One of two independent experiments with n = 5–6 littermate mice per group. (K–M) Naive mice or mice infected with LCMV-Arm or LCMV-Cl13 70 d earlier were treated with DSS or H2O control for 7 d. (K) Graph shows average percentage body weight change from commencement of DSS treatment. *, DSS-treated group’s weight is significantly different from that of other DSS-treated groups. (L) Table indicates survival of treated mice. (M) Graph shows LI length 8 d after the indicated treatment. n = 10 mice per group from two independent experiments. Error bars indicate SEM (A–M).

