Figure 4.
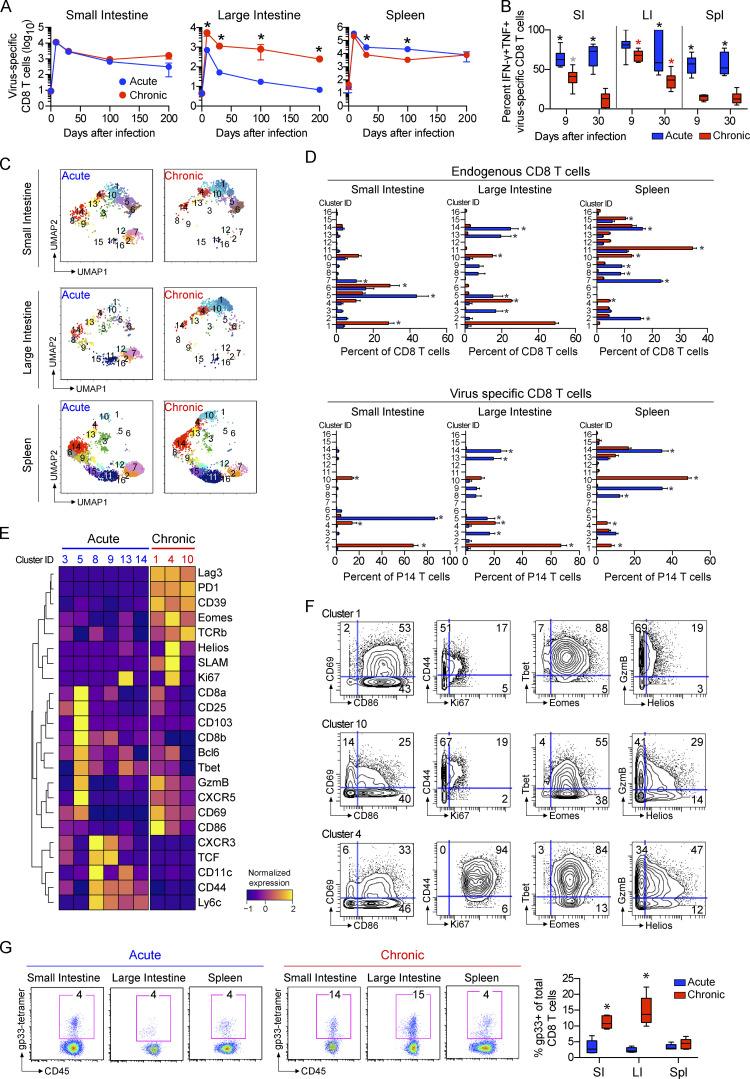
CD8 T cell accumulation and phenotype in the GIT during chronic viral infection. Mice received virus-specific CD8+ P14 T cells and were subsequently infected with LCMV-Arm (acute) or LCMV-Cl13 (chronic). (A) Graphs show the number of virus-specific CD8 P14 T cells detected in the SI, LI, and spleen at the indicated dpi. n = 4–10 mice per group per time point from two independent experiments. *, P < 0.05 by ANOVA test. (B) 9 and 35 dpi, SI, LI, and spleen cells from LCMV-Arm– and LCMV-Cl13–infected mice were stimulated with LCMV-GP33–41 peptide. Graphs show the proportion of IFN-γ and TNF-α coproducing virus-specific CD8 P14 T cells from each compartment. Black asterisk, LCMV-Arm versus LCMV-Cl13, P < 0.05 within the tissue at that time point; gray asterisk, LCMV-Cl13 cytokine production in SI versus spleen, P < 0.05; red asterisk, LCMV-Cl13 cytokine production versus both other organs, P < 0.05 at that time point. n = 4–10 mice per group per time point from two independent experiments. (C–E) PhenoGraph clustering of total CD8 T cells and virus-specific CD8 P14 T cells analyzed by CyTOF at 35 dpi. (C) UMAP plots colored according to PhenoGraph-defined clusters. (D) Bar graphs show the relative proportion of each cluster among total CD8 T (endogenous) and P14 cells (virus specific). *, P < 0.05 acute versus chronic by two-way ANOVA. (E) Heatmap includes the clusters significantly increased (P < 0.05 by ANOVA) in virus-specific CD8 P14 T cells following LCMV-Arm (blue; acute) or LCMV-Cl13 (red; chronic) infection. (F) Contour plots show expression of the indicated markers in clusters 1, 10, and 4. Shown is one of two independent experiments with n = 5 mice per group. (G) LCMV-GP33 tetramer expression on CD8 T cells in the SI, LI, and spleen at 30 dpi after LCMV-Arm or LCMV-Cl13 infection. Box plots (left) and representative flow plots (right) show the percentage of tetramer-positive CD8 T cells in each organ. Shown is one of two independent experiments with n = 5 mice per group. *, P < 0.05 by ANOVA test. Error bars indicate highest and lowest values (A–G).

