Figure 5.
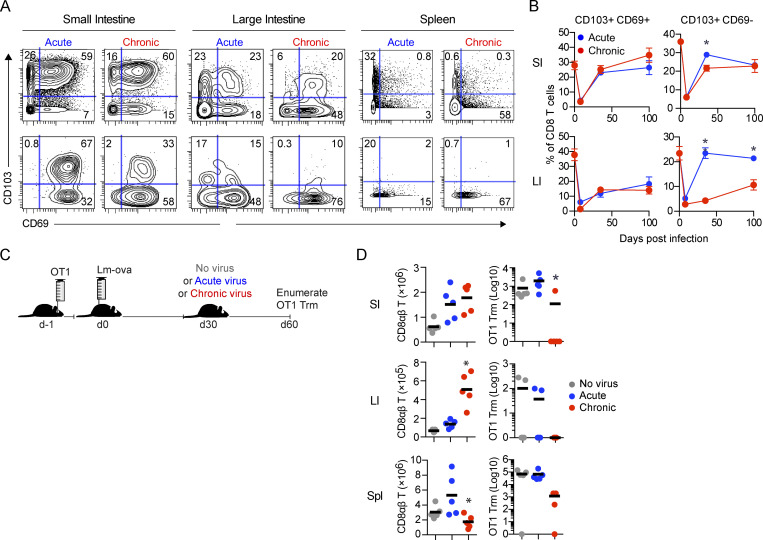
Erosion of tissue-resident memory in the chronically infected GIT. (A and B) Mice received virus-specific CD8 P14 T cells and were subsequently infected with LCMV-Arm (acute) or LCMV-Cl13 (chronic). (A) At 35 dpi, immune cells from the SI, LI, and spleen were analyzed by CyTOF. Contour plots show representative CD69 and CD103 expression by total CD8 T cells and virus-specific CD8 P14 T cells from one of two independent experiments with n = 5 mice per group. (B) Graphs show the proportion of CD103+CD69− and CD103+CD69+ cells among total CD8 T cells in the SI and LI at the indicated time points from one of two independent experiments with n = 5 mice per group. *, P < 0.05 by t test. (C) Experimental schematic depicting mice that received OT1 cells and subsequently were infected with Listeria-OVA (Lm-ova). 30 d later, mice were challenged with no virus or LCMV-Arm or LCMV-Cl13 infection. 30 d after challenge, CD8 responses in the SI, LI, and spleen were analyzed by flow cytometry. (D) Graphs depict the number of total CD8 T cells and OT1 Trm cells (CD103+) in the SI and LI or the total number of OT1 cells in the spleen. *, P < 0.05 by Kruskal-Wallis test. Shown is one of two independent experiments with n = 5 mice per group. Error bars indicate SEM (A–D).

