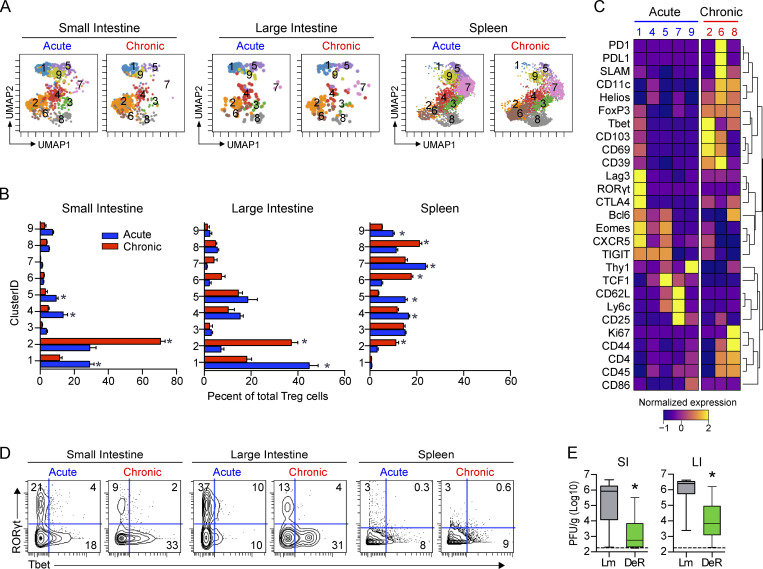
Figure 7.
T reg cell depletion augments viral clearance from the chronically infected GIT. (A–D) Mice were infected with LCMV-Arm (acute) or LCMV-Cl13 (chronic), and at 35 dpi, T reg cells (CD4+Foxp3+) were analyzed by CyTOF from SI, LI, and spleen and clustered using PhenoGraph. (A) UMAP plots colored according to PhenoGraph-defined clusters. Numbers in each UMAP plot indicate the cluster. Plots are concatenated from n = 5 mice per group from one of two independent experiments. (B) Bar graphs show the relative proportion of each cluster within the total T reg cell population. *, P < 0.05 LCMV-Arm versus LCMV-Cl13 by ANOVA test. n = 5 mice per group from one of two independent experiments. (C) Heatmap shows row-normalized expression of clustering markers in clusters where P < 0.05 by ANOVA test for LCMV-Arm infection (blue) versus LCMV-Cl13 infection (red). Heatmap was concatenated from n = 5 mice per group from one of two independent experiments. (D) Representative contour plots show Tbet and RORγt expression on total FoxP3+ cells from each organ. Plots were concatenated from n = 5 mice per group from one of two independent experiments. (E) DEREG (DeR) or littermate (Lm) control mice were infected with LCMV-Cl13 and 50–60 d later were treated with DT to deplete Foxp3+ T reg cells. Box plots show virus titers in the SI and LI 9 d after DT treatment. Error bars indicate the highest and lowest values. Data from three independent experiments with n = 14–15 mice per group. *, P < 0.05 by t test.

