Figure 7.
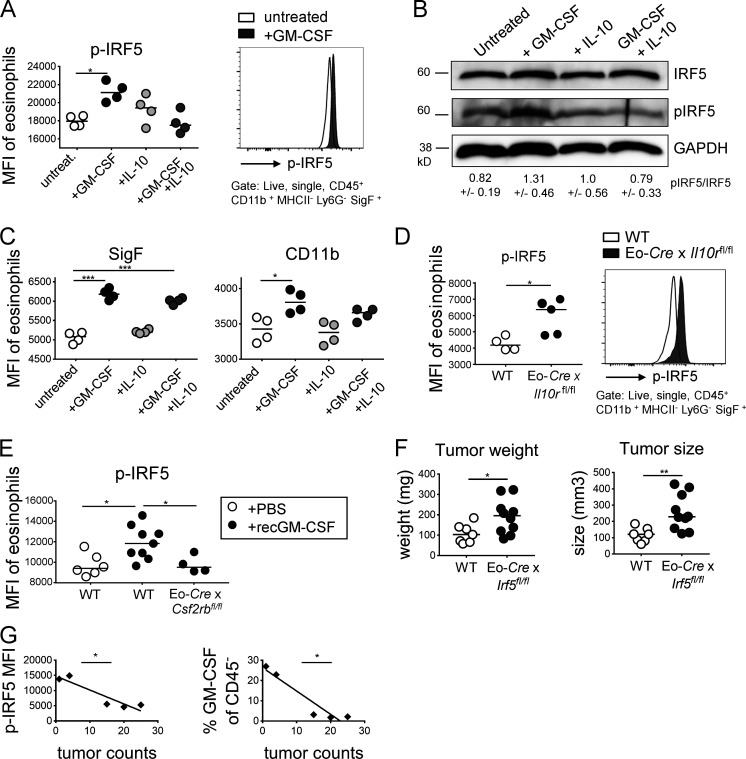
GM-CSF-activated IRF5 is a critical regulator of eosinophil activities in the TME. (A–C) Splenocytes from IL-5–transgenic donors were treated overnight with 20 ng/ml GM-CSF, 50 ng/ml IL-10, or both cytokines. Cells were either stained for phosphorylated IRF5 and the signal in eosinophils was quantified by flow cytometry (A, summary plot of MFI and representative histogram, n = 4 technical replicates per condition) or subjected to protein extraction and Western blotting with a p-IRF5-specific antibody (B, total IRF5 and GADPH shown as loading controls). The quantification of three Western blots representing independent experiments is shown below the lanes as mean ± SEM. (C) The same cells as shown in A were also stained for Siglec F and CD11b to assess the activation state of eosinophils in the cultures. (D) IRF5 activation as assessed by p-IRF5–specific flow cytometry of eosinophils in tumors of Eo-Cre × Il10ra fl/fl mice and their Cre-negative littermates. One representative experiment of two is shown, n = 4–5 tumors per genotype. (E) IRF5 activation as assessed by p-IRF5–specific flow cytometry of eosinophils in tumors of Eo-Cre × Csf2rb fl/fl mice and their Cre-negative littermates that were treated three times weekly with recombinant GM-CSF or PBS as indicated. (F) Tumor weights and volumes at the study endpoint of Eo-Cre × Irf5 fl/fl mice and their Cre-negative littermates that had been subcutaneously injected with MC38 cells. Data are pooled from two independent experiments. (G) GM-CSF in CD45 negative leukocytes (right panel, correlation coefficient ρ = −0.948) and p-IRF5 in eosinophils infiltrating adenomas of ApcMin/+ mice treated with isotype control antibody (left panel, ρ = −0.927) as assessed flow cytometrically, relative to tumor counts (small intestine plus colon, as shown in Fig. 3). *, P < 0.05; **, P < 0.01; and ***, P < 0.001; as calculated by Mann–Whitney test (D and F), by one-way ANOVA with Tukey’s post-test (A, C, and E) or by linear regression (G).

