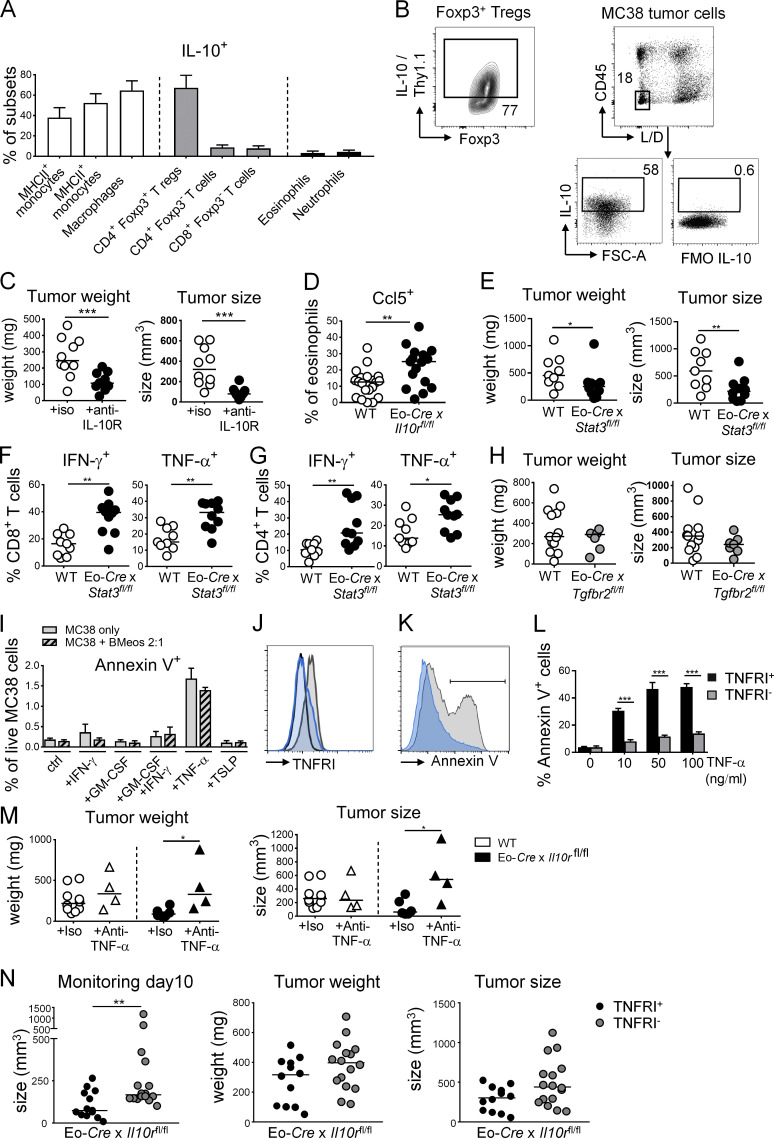
Figure S3.
The IL-10–STAT3 signaling axis in eosinophils suppresses their antitumor properties. (A) Frequencies of Thy1.1 (IL-10)+ cells in the indicated cellular compartments of the colonic lamina propria in (naive) IL-10 reporter (10BiT) mice (n = 8 mice). Means + SD are shown. (B) Representative FACS plot of Thy1.1 (IL-10) expression by intratumoral Foxp3+ T reg cells and IL-10 expression by MC38 tumor cells growing subcutaneously in mice as determined by intracellular cytokine staining relative to FMO (fluorescence minus one control). FSC-A, forward scatter area; L/D, live/dead. (C) WT C57BL/6 mice were subcutaneously injected with 5 × 10⁵ MC38 cells, treated twice weekly with anti–IL-10R or control antibody for the duration of the experiment, and analyzed after 15 d with respect to their tumor weights and volumes (n = 10 tumors per group). (D) Ccl5 expression by intratumoral eosinophils in Eo-Cre × Il10rafl/fl mice relative to their WT littermates (n = 17–20 tumors per genotype). (E–G) Eo-Cre × Stat3fl/fl mice and their WT littermates were subcutaneously injected with 5 × 10⁵ MC38 cells and analyzed after 15 d with respect to their tumor weights and volumes (E) and their intratumoral frequencies of IFN-γ+ and TNF-α+ CD4+ and CD8+ T cells as assessed by intracellular cytokine staining upon restimulation with PMA/ionomycin (n = 9–10 tumors per genotype). (H) Eo-Cre × Tgfbr2fl/fl mice and their Cre-negative littermates were subcutaneously injected with 5 × 10⁵ MC38 cells and analyzed after 15 d with respect to their tumor weights and volumes (n = 7–12 tumors per genotype). Data in C and H are from one experiment, data in D are pooled from three independent experiments, and data in E–G are pooled from two independent experiments. (I) Apoptosis rate as determined by Annexin V staining followed by flow cytometry of MC38 cells cultured overnight in the presence or absence of 10 ng/ml of the indicated recombinant cytokines and in the presence or absence of bone marrow–derived eosinophils at a ratio of 2:1 (tumor/eosinophil). (J) TNFRI expression of MC38 cells subjected to genomic editing with a TNFRI-specific guide RNA (in blue) or an irrelevant guide RNA (gray); cells were stained with a TNFRI-specific (gray, blue) or control antibody (black). (K and L) Apoptosis as determined by Annexin V staining followed by flow cytometry, of MC38 cells described in J cultured o/n in the presence or absence of the indicated concentrations of TNF-α. A representative Annexin V histogram is shown in K and a summary plot of four replicate samples per condition from two independent experiments is shown in L. (M) Tumor weights and volumes at the study endpoint of Eo-Cre × Il10ra fl/fl mice and their Cre-negative littermates injected with MC38 cells, and treated twice weekly with 250 µg/dose of a TNF-α–neutralizing antibody or its isotype control (n = 4–10 tumors). (N) Tumor weights and volumes at the study endpoint of Eo-Cre × Il10ra fl/fl mice that have been subcutaneously injected with MC38 cells that express either normal (TNFRI+) or low amounts (TNFRI−) as shown in J due to CRISPR-mediated deletion of the TNFR1 locus (n = 12–16 tumors per group). The tumor size on day 10 is shown alongside tumor sizes and weights at the study endpoint (day 15). *, P < 0.05; **, P < 0.01; ***, P < 0.001.

