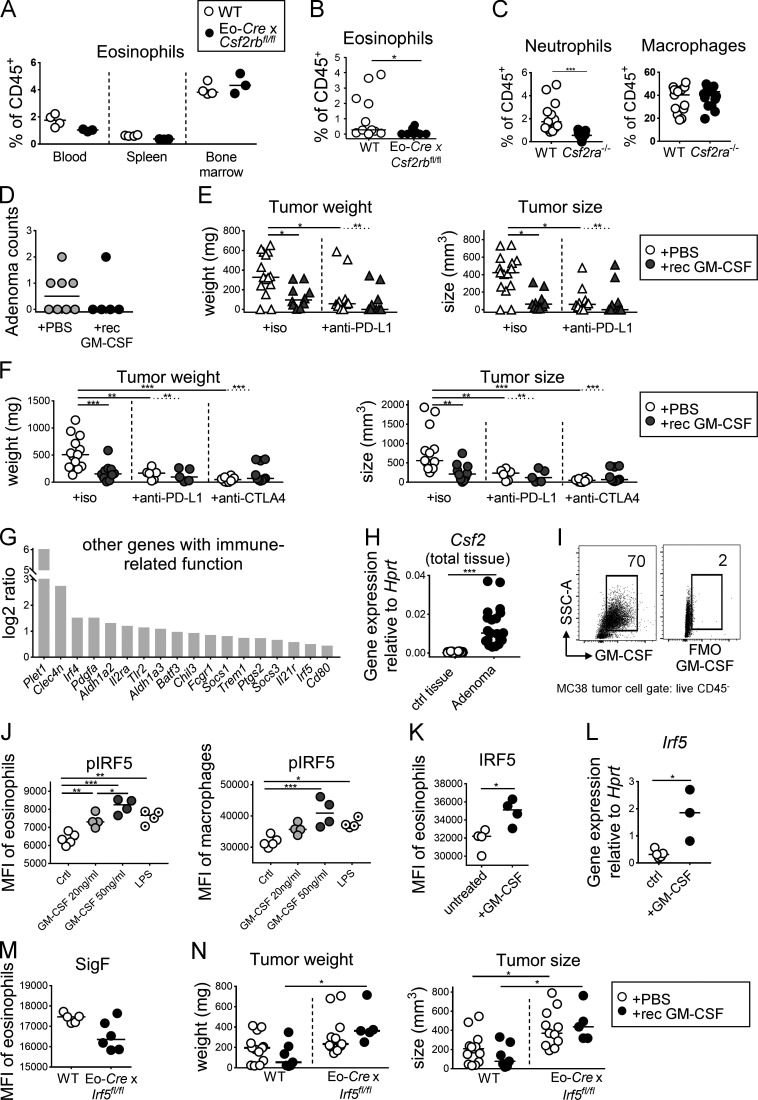
Figure S4.
GM-CSF promotes tumor control through the activation of IRF5, but does not synergize with checkpoint blockade. (A) Systemic eosinophil frequencies are not affected by the deletion of Csf2rb in the eosinophil compartment. Eo-Cre × Csf2rbfl/fl mice and their Cre-negative littermates were examined with respect to their eosinophil frequencies, as determined by flow cytometry of the indicated tissues (n = 3–4 mice per genotype). (B) Eosinophil frequencies in the tumors of Eo-Cre × Csf2rbfl/fl mice and their Cre-negative littermates (n = 10–11 tumors per genotype). (C) Myeloid cell frequencies in the tumors of CSF2ra−/− mice and WT (n = 13–17 tumors per genotype). Data are pooled from two studies. (D) ApcMin/+ mice were treated three times weekly with recombinant GM-CSF during the last 3 wk of a 4-mo experiment. At the study endpoint, adenoma formation in the colon was quantified by counting individual polyps with diameters of >1 mm. Data are from one experiment and representative of two (n = 5–8 mice per group). (E) WT BALB/c mice were injected with CT26 cells and treated three times weekly with recombinant GM-CSF and/or twice weekly with a PD-L1–specific or isotype control antibody as indicated. Tumor weights and volumes are plotted for one large study (n = 10–15 tumors per group). (F) WT C57BL/6 mice were injected with MC38 cells and treated three times weekly with recombinant GM-CSF and/or twice weekly with a PD-L1–specific or CTLA4-specific antibody or isotype control as indicated. Tumor weights and volumes are pooled from two independently conducted studies (n = 6–13 tumors per group). (G) Expression of the indicated immune response–related transcripts in bone marrow–derived WT eosinophil cultures that were treated overnight with 20 ng/ml recombinant GM-CSF or vehicle control and subjected to RNA-sequencing–based transcriptome analyses, as shown in Fig. 6. The log2 ratio is shown for GM-CSF–treated cells relative to control. (H) GM-CSF (Csf2) expression, as determined by quantitative RT-PCR, in adenomas harvested from ApcMin/+ mice relative to adjacent control tissue. Each data point represents one tumor or tissue, respectively (n = 20 samples per condition). (I) GM-CSF expression, as determined by FACS, of subcutaneously growing MC38 cells at the study endpoint relative to FMO (fluorescence minus one control). (J) Splenocytes from IL-5 transgenic donors were treated for 30 min with the indicated amount of recombinant GM-CSF, or with 100 ng/ml LPS and stained for lineage markers and for phosphorylated IRF5; the p-IRF5 signal in Siglec F-positive eosinophils (left panel) and F4/80-positive macrophages (right panel) was quantified by flow cytometry. (K) Splenocytes from IL-5–transgenic donors were treated overnight with 20 ng/ml GM-CSF. Cells were stained for IRF5 and the signal in eosinophils was quantified by flow cytometry. The summary plots in J and K show the MFI (n = 4–5 parallel cultures each). (L) IRF5 expression, as determined by quantitative RT-PCR in sorted eosinophils from IL-5–transgenic splenocyte cultures that have been exposed overnight to 20 ng/ml GM-CSF (n = 3–4 samples per condition). (M) Eosinophil activation in tumors of Eo-Cre × Irf5fl/fl mice and their WT littermates, as assessed by flow cytometric analysis of Siglec F expression (n = 5–6 per genotype, P = 0.053. (N) Tumor weights and volumes of Eo-Cre × Irf5fl/fl mice and their WT littermates that have (black circles) or have not (white circles) been treated with recombinant GM-CSF three times weekly for the duration of the 2-wk experiment (n = 5–13 tumors per group). Data are pooled from two studies. *, P < 0.05; **, P < 0.01; ***, P < 0.001.

