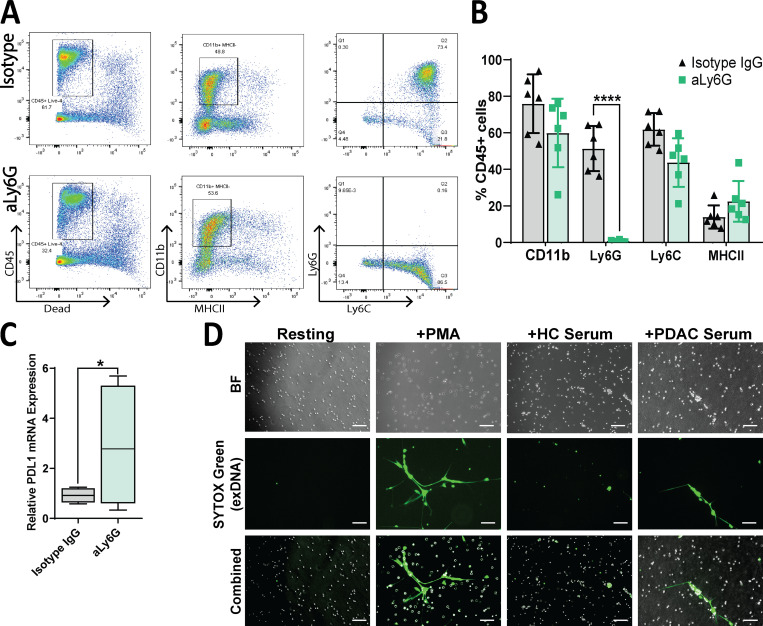
Figure S5.
Neutrophil depletion and NETosis imaging with human samples. (A) Representative plots depicting flow cytometric analysis of orthotopic tumors treated with isotype IgG or aLy6G antibodies. (B) Quantification of indicated markers as gated in A, as a percentage of viable CD45+ cells. (C) Quantitative RT-PCR analysis of relative PD-L1 mRNA expression in orthotopic tumors treated with isotype IgG or aLy6G antibodies (n = 5 per group). (D) Representative images of human neutrophils stimulated with PMA or serum of healthy control subjects (HC) or patients with PDAC. Green = extracellular (ex) DNA, as stained by SYTOX Green. Scale bars represent 100 µm. *, P < 0.05; ****, P < 0.0001. BF, bright field.

