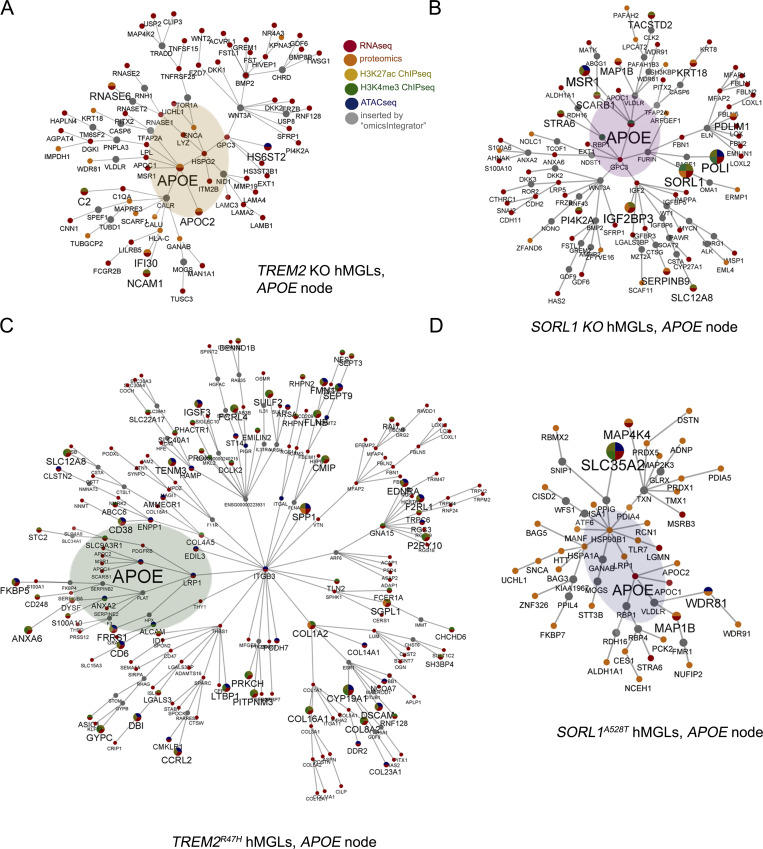
Figure 2.
Integrative multi-omic analysis demonstrates convergence at the APOE locus in mutant hMGLs. (A–D) APOE pathway network in individual hMGL lines. OmicsIntegrator network branches containing APOE is depicted from multi-omic TREM2 KO (A), TREM2R47H (C), SORL1 KO (B), and SORL1A528T (D) hMGL datasets. Color scheme for nodes identified by a particular analytical dataset is shown in A; node and font size are scaled according to identification across multi-omic datasets. APOE is intentionally marked with an increased font size, and adjacent nodes are highlighted. Gray nodes depict node inserts applied by the OmicsIntegrator algorithm to connect adjacent networks.

