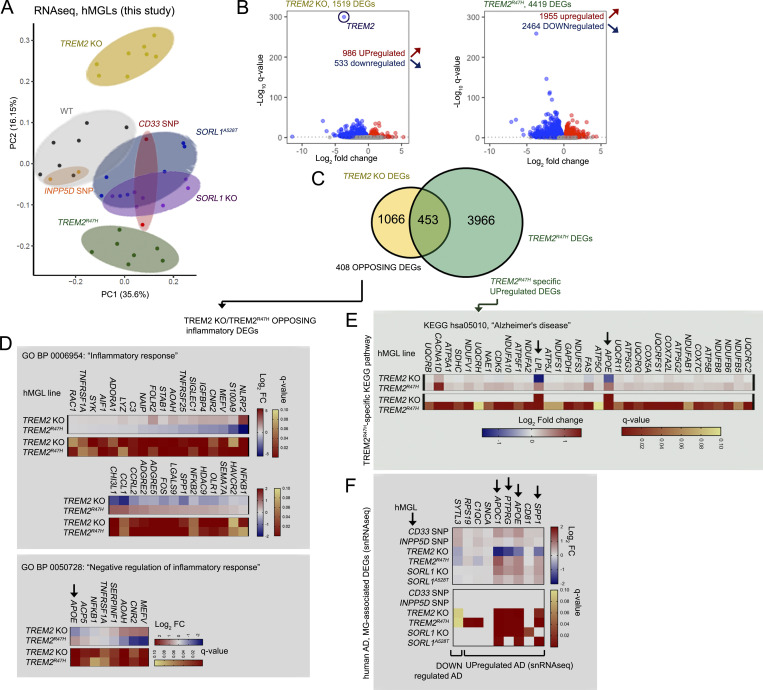
Figure 3.
AD-related transcriptomic signatures are altered in mutant hMGLs. (A) PCA plots derived from RNA-seq profiles in mature CD33 SNP (n = 2, red), INPP5D SNP (n = 2, orange), TREM2 KO (n = 8, yellow), TREM2R47H (n = 7, green), SORL1 KO (n = 7, purple), and SORL1A528T (n = 7, blue) and WT (n = 7, black) hMGLs. Log2-transformed transcripts per million values were used in the PCA after adjusting for batch effect. (B–F) Transcriptomic analysis reveals divergence of TREM2 KO and R47H hMGLs. (B) Volcano plot depicting significantly up-regulated (red) and down-regulated (blue) differentially regulated genes (DEGs, q < 0.1) in TREM2 KO (yellow) and TREM2R47H hMGLs; log10 q-values (y axis) and log2 fold change (x axis) are plotted for individual DEGs. (C) Venn diagram depicts overlapping DEGs in TREM2 KO and R47H hMGL lines with matched up- or down-regulatory trends. GO analysis of 408 DEGs showing opposing up- or down-regulatory expression trends demonstrate enrichment in BP categories including “inflammatory response” (D, top) and “negative regulation of inflammatory response” (D, bottom). GO analysis of TREM2R47H hMGLs indicate enrichment of DEGs related to KEGG “Alzheimer’s disease” pathways (E). (F) Analysis of RNA-seq trends in microglial genes previously shown to be altered in human AD in hMGLs. Heatmaps in D–F indicate log2 fold change (blue/red; top) and q-value (red/yellow; bottom); arrows indicate AD-associated DEGs with opposing trends in TREM2 KO and R47H hMGLs.

