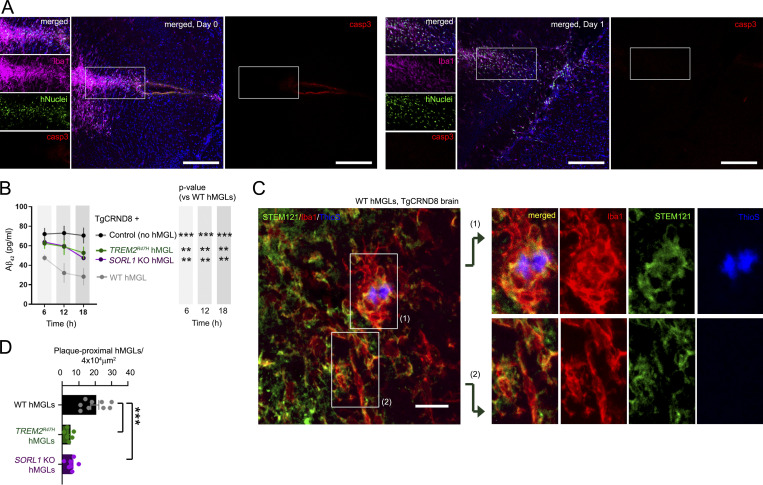
Figure 5.
Characterizing xenotransplanted hMGLs in mouse brain. (A) Histological analysis of 2 × 10⁵ hMGLs stereotactically injected into hippocampus of human MCSF knockin mouse (Rag2−/−; γc−/−; CSF1h/h); brain tissue was processed/imaged following injection (6 h, left) or after 1 d (day 1, right). Brain tissue sections were stained for Iba1 (purple), human nuclei (hNuclei, green), active caspase-3 (casp3, red), and DAPI (blue). Scale bars, 200 µm. (B) Human Aβ1-42 levels measured in ISF from TgCRND8 mouse brain xenotransplanted with WT, TREM2R47H, and SORL1 KO hMGLs as determined by ELISA. Statistical significance was determined by two-way ANOVA with Dunnett's multiple comparison (**, P < 0.01; ***, P < 0.001); graph depicts mean ± SEM, n = 4 animals for each group with duplicate ELISA replicate readings from each animal. (C) 3-mo-old TgCRND8 mouse brain xenotransplanted with WT hMGLs into the left hippocampal hemisphere was stained with antibodies to detect human cytoplasm (STEM121, green), Iba1 (red), or ThioS to detect Aβ plaques (blue). Magnified images show that WT hMGLs (green) were able to fully encapsulate plaques in WT (top panel). Scale bar, 20 µm. (D) Phagocytosis of Aβ in xenotransplanted hMGLs is quantified in C. Statistical significance was determined by one-way ANOVA with Tukey’s multiple comparison (***, P < 0.01). Data were derived from n = 3–5 animals for each group; 6–10 sagittal brain sections (30 µm) per animal were subjected to immunostaining analysis. Graph depicts mean ± SEM; data points represent averages from two or three images per animal. Images in A and C are representative images from three independent experiments.

