Figure 7.
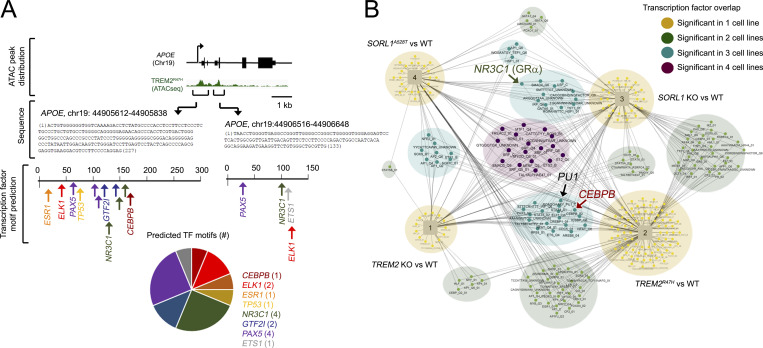
Modulation of transcription networks in AD-associated hMGLs. (A) Two transcriptionally active regions within the APOE locus identified by ATAC-seq were characterized for transcription factor (TF) motifs using PROMO. TFs were plotted for the two ATAC-seq peaks (nucleotides [nts] 1–227, Chr19:44905612; nts 1–133, Chr19:44906516) depicted in green. Number of predicted TFs in these two regions is indicated in the pie chart. (B) Upstream transcription factors with targets significantly enriched for genes dysregulated in all four -omics analytical datasets were plotted on the network map shown. Cell line–specific transcription factors are annotated by circles, and cell lines are annotated by squares in the network diagram. Shared transcription factors are connected to each cell line in which they are enriched. Some transcription factors are enriched in a single cell line (small yellow nodes), while others are enriched in two cell lines (light green), three cell lines (teal), or all four cell lines (dark purple). PU.1, NR3C1, and CEBPB are marked in large font on the Cytoscape map.

