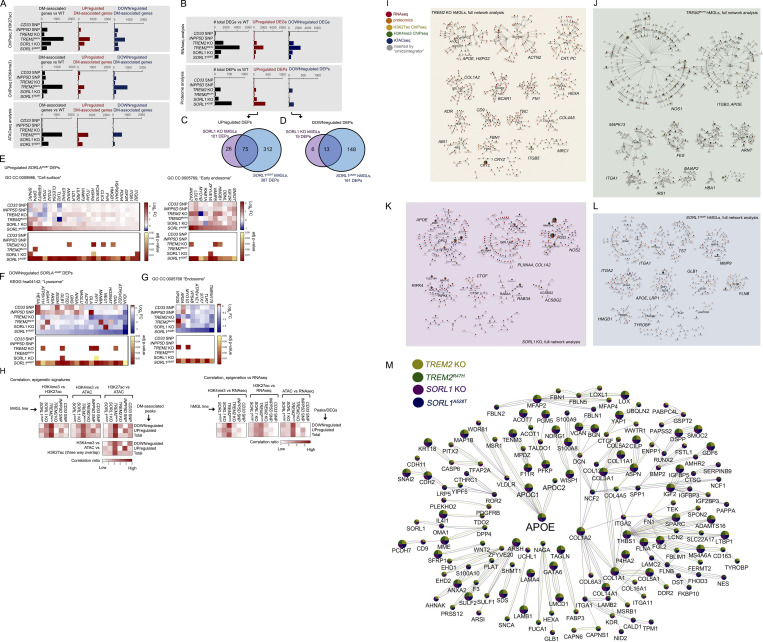
Figure S2.
Overview of epigenetic, transcriptomic, and proteomic changes; correlation between epigenetic and transcriptomic signatures; and integrative multi-omic analysis of gene landscapes in mutant hMGLs. (A and B) Overall total number of DM gene-associated peak signals by ATAC-seq, and ChIP-seq (A) DEGs (q < 0.1), and DEPs by RNA-seq/proteomic analysis, respectively (B), in hMGLs generated and characterized in this study (black bars). Numbers of up-regulated (middle graphs, red bars) and down-regulated (right graphs, blue bars) DEGs, DEPs, and DM-associated genes are also presented as indicated. (C–G) Analysis of DEPs in SORL1A528T hMGLs, showing Venn overlap analysis between up-regulated (C) and down-regulated (D) DEPs in SORL1 KO (purple) and A528T hMGLs (blue). GO DAVID analysis of up-regulated SORL1A528T DEPs show enrichment in “cell surface” and “early endosome” CCs (E), whereas down-regulated SORL1A528T DEPs feature enrichment in lysosome-associated KEGG pathways (F) and endosome components (G). (H) Correlation of overlapping DM-associated epigenetic signatures (heatmaps, left). Heatmap depicting relative overlap between down-regulated and up-regulated ChIP-seq and ATAC-seq DM-associated peak signatures in hMGL lines, as calculated from overlapping components from ChIP-seq and ATAC-seq datasets (left heatmaps). Correlation of overlapping DM-associated epigenetic and transcriptomic signatures (heatmaps, right). Heatmap depicting relative overlap between down-regulated and up-regulated DEGs (RNA-seq) and epigenetic DM-associated peak profiles. Pairwise correlation ratios in Venn overlap diagrams (see H in Data S1; top heatmaps) are ratios of overlapping up-regulated, down-regulated, or total signatures over the total signatures (for each pairwise category) observed in each line (XhMGL line value for each hMGL line); ratios are normalized by dividing each XhMGL line value over the sum of all XhMGL line values for up-regulated, down-regulated, or total signatures. Heatmaps for three-way overlap (bottom heatmap) are ratios of down-regulated, up-regulated, or total overlapping signatures observed in all three epigenetic datasets over the total number of signatures for each hMGL line (YhMGL line value). Normalized values were established by dividing YhMGL line values from each line over the total of all YhMGL line values. Normalized correlation ratios were calculated for epigenetic/RNA-seq heatmaps in right heatmaps, as described for left heatmaps (ChIP-seq/ATAC-seq correlation). (I–L) Full molecular pathway analyses of TREM2 KO, TREM2R47H, SORL1 KO, and SORL1A528T hMGLs through integrative multi-omic analysis (OmicsIntegrator). Complete map of genes dysregulated in the mutant TREM2 KO (I), TREM2R47H (J), SORL1 KO (K), and SORL1A528T (L) hMGL lines compared to WT. Branches were defined in the OmicsIntegrator network by removing the root node. Resulting branches are displayed in a grid layout, with the most central gene highlighted with large font and labeled adjacently for each cytoscape network group with significantly centralized nodes. Node color schemes defined by various analytical platforms are indicated in I as red (RNA-seq), orange (proteomics), yellow (H3K27ac ChIP-seq), green (H3K4me3 ChIP-seq), blue (ATAC-seq), and gray (inserted by the OmicsIntegrator algorithm). See extended Data S1 for enlarged network diagrams for I–L. (M) The network of gene commonly altered across multiple cell lines. Integrative analysis implicate dysregulation of APOE in TREM2 KO and R47H, and SORL1 KO and A528T hMGL lines. Genes depicted within the Cytoscape network map were affected in one or more analytical dataset by at least three out of the four TREM2/SORL1 mutant hMGL cell lines compared to WT. Colored pie charts comprising network nodes indicate hMGL lines dysregulated at particular nodes; larger nodes indicate genes modulated in all four hMGL lines. AD-related genes of particular interest (APOE, APOC1, and APOC2) were intentionally highlighted with an enlarged font size. Edge colors indicate an edge identified within the multi-omic network for a particular hMGL line; a color scheme for nodes and edges within the network is shown (TREM2 KO, yellow; TREM2R47H, green; SORL1 KO, purple; SORL1A528T, blue).

