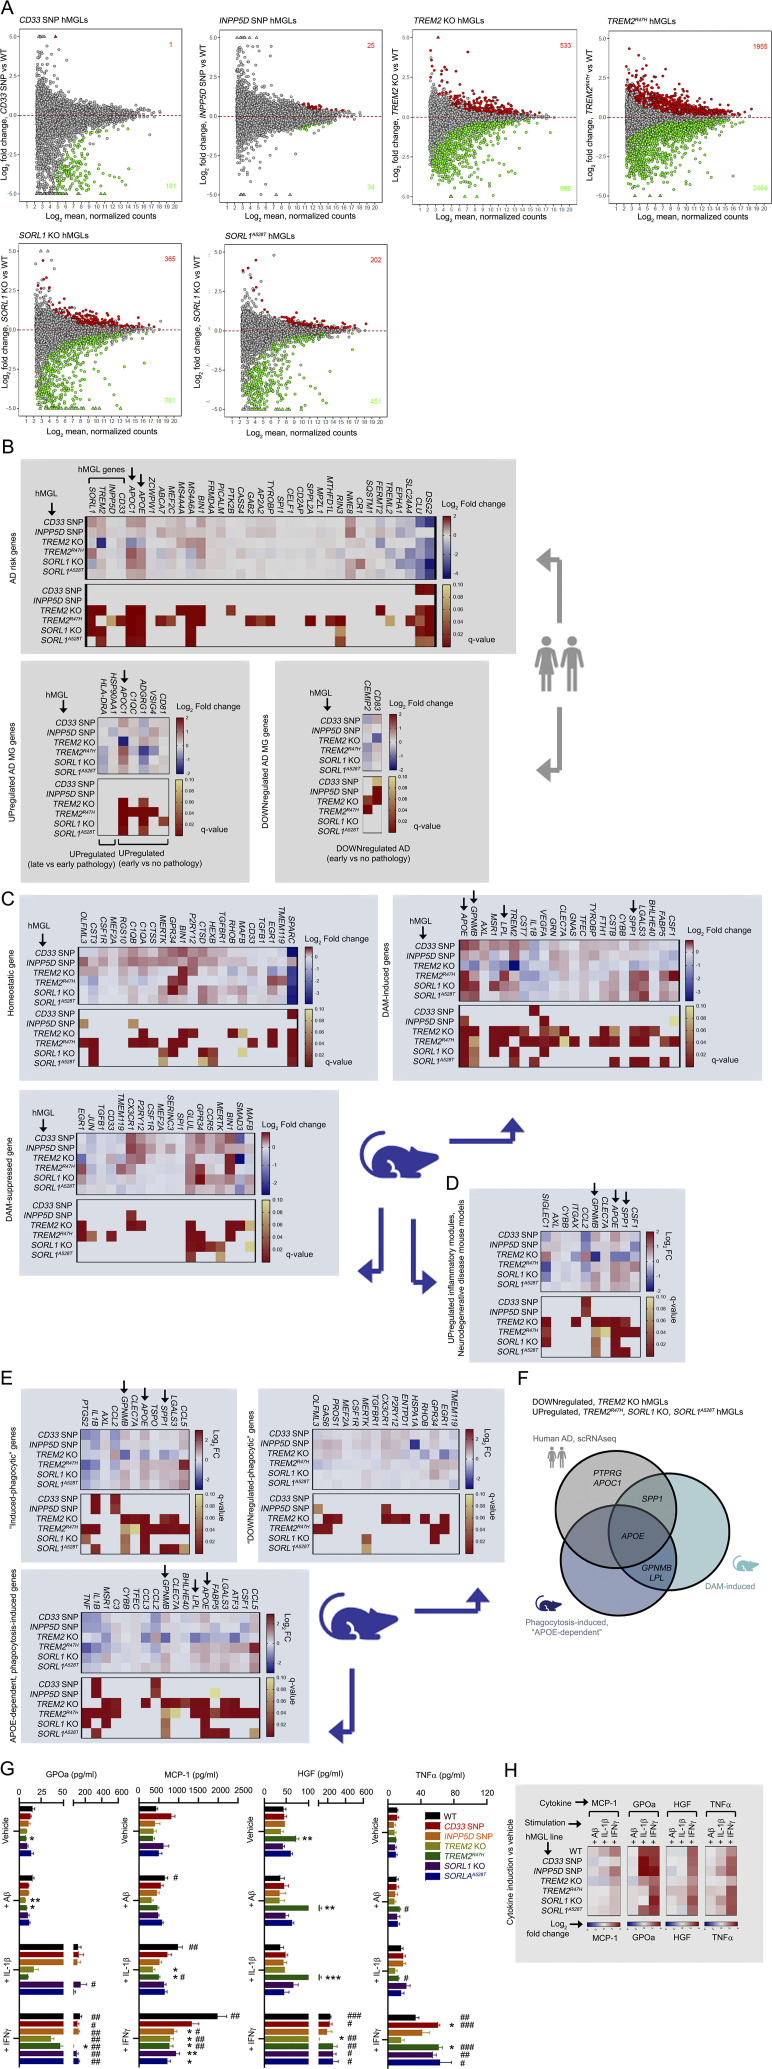
Figure S3.
Transcriptomic analysis of mutant hMGLs. (A) MA plots depicting differential gene expression in the different hMGL lines characterized by RNA-seq analysis. Log2 fold change (y axis) and log2 mean normalized counts (x axis) are shown. Red (up-regulated) and green (down-regulated) components, and DEG counts are indicated with at a q-value cutoff of q < 0.1. (B) Characterizing human AD-associated transcriptomic gene profiles in hMGLs. Heatmap profiles depicting log2 fold change (red/blue) and q-value (red/yellow) of DEGs related to microglial genes potentially linked AD risk (upper graph), and differentially up-regulated (lower left) or down-regulated (lower right) in human AD previously characterized by single cell RNA-seq (Mathys et al., 2019). (C) Homeostatic or DAM transcriptomic gene profiles of hMGLs. Up-regulated or down-regulated DEG profiles and q-values for the hMGL panel were plotted as indicated for homeostatic, DAM-induced, or DAM-suppressed microglial DEG profiles (RNA-seq) previously characterized in AD mice. Color scale represents log2 fold change (blue/red) or q-value (red/yellow). (D) hMGL RNA-seq profiles were characterized for up-regulated inflammatory components identified in various neurodegenerative mouse disease models (Krasemann et al., 2017). Arrows in B–D mark genes down-regulated in TREM2 KO and up-regulated in TREM2R47H hMGLs. (E) hMGL RNA-seq profiles were characterized for genes induced (upper left) and suppressed (upper right) in phagocytically active microglia. hMGL RNA-seq profiles were also characterized for microglia genes induced by phagocytosis only in the presence of APOE (APOE-dependent genes induced by phagocytosis; Krasemann et al., 2017). Genes down-regulated in TREM2 KO and up-regulated in TREM2R47H hMGLs are marked by arrows. (F) Genes from human AD and AD/phagocytic microglia mouse models down-regulated in TREM2 KO and up-regulated in TREM2R47H hMGLs; APOE is shared among all three groups. (G) Secretion of cytokines and chemokines in hMGLs stimulated with Aβ1-42 oligomers (1 µM), IL-1β (20 ng/ml), and IFN-γ (20 ng/ml) as determined by ELISA multiplex assay (mean± SEM). Statistical analyses were determined by two-way ANOVA with Dunnett's multiple comparison. *, P < 0.05; **, P < 0.01; and ***, P < 0.001 were derived by comparing each genotype vs. WT under different stimuli. #, P < 0.05; ##, P < 0.01; and ###, P < 0.001 were derived by comparing different stimuli vs. vehicle within the same genotype. (H) Induction of cytokines and chemokines in hMGLs stimulated with Aβ1-42 oligomers (1 µM), IL-1β (20 ng/ml), and IFN-γ (20 ng/ml) as determined by ELISA multiplex assay. Heatmaps indicate log2 fold change of cytokines/chemokines indicated (MCP-1, GPOa, HGF, and TNF-α) above vehicle treatment. Results from G and H are derived from three replicate cultures in n = 3 independent experiments.

