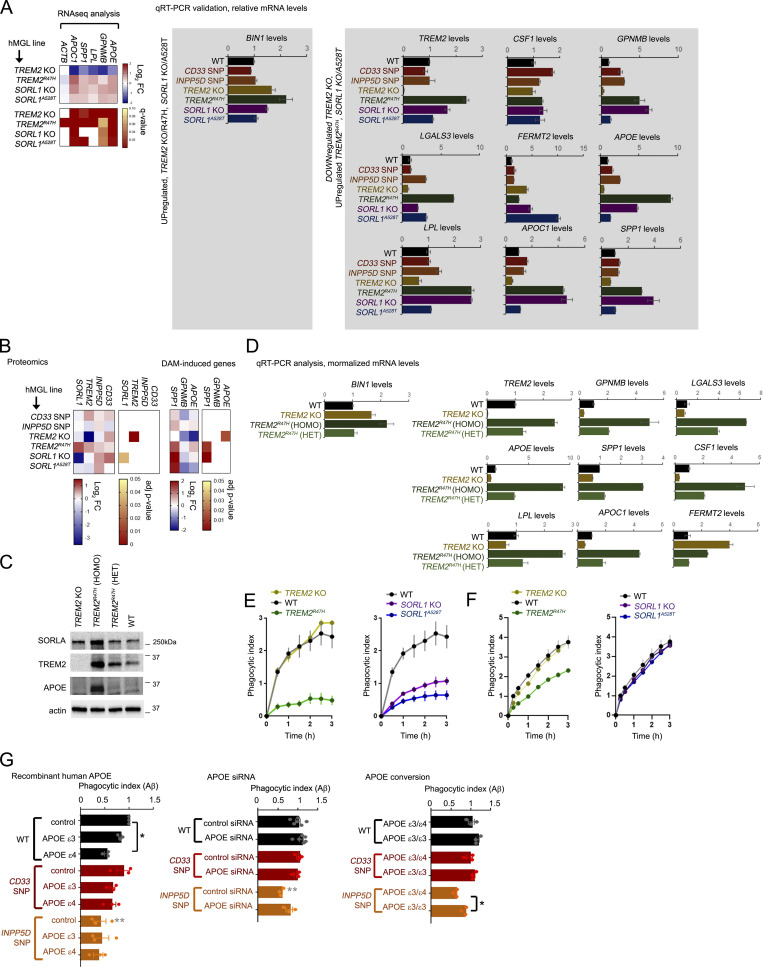
Figure S4.
Analysis of expression and epigenetic profiles at AD and DAM-associated gene loci. (A) qRT-PCR validation of AD/DAM-related targets. AD-related components up-regulated in TREM2 KO/R47H and SORL1 KO/A528T (left), or down-regulated in TREM2 KO/up-regulated in TREM2R47H hMGLs by RNA-seq analysis were verified in hMGLs by qRT-PCR analysis (normalized over actin, and compared with WT, set to 1.0). One representative experiment is shown (mean ± SEM, n = 3 replicates). Heatmap of relevant targets from RNA-seq analysis is shown (right). (B) Evaluation of hMGL genes (left) and AD/DAM-related targets in the hMGL lines by label-free proteomic analysis. (C) SORLA, TREM2, and APOE levels were characterized in TREM2 KO; TREM2R47H homozygous (HOMO) and heterozygous (HET) hMGLs were compared with WT by immunoblot analysis. Western blot shown is representative of three independent experiments. (D) AD/DAM-related targets were quantified in TREM2 KO (yellow bars), TREM2R47H homozygous (HOMO, dark green), and heterozygous (HET, lighter green) hMGLs by qRT-PCR analysis. Graphed results are from n = 3 independent experiments. (E and F) Phagocytosis of Aβ1-42 (555-Aβ; E) or tau (555-tau; F) oligomers in WT and AD-variant hMGLs over time. PI was determined by measuring average fluorescence intensity in individual hMGL lines in comparison to the 15 min time point, and normalized to WT at the 15 min time point (set to 1.0). Values represent mean ± SEM from n = 3 replicate wells. Mean phagocytotic index values for the hMGL lines was quantified at the 3 h time point, and shown in the adjacent bar graph (mean ± SEM). (G) WT or mutant hMGLs were treated with 5 µg/ml recombinant human APOEε3 or APOEε4 or left untreated (control), together with 555-Aβ1-42 oligomers (left graph). Phagocytosis of 555-Aβ1-42 oligomers was measured in real time, and PI was determined by measuring average fluorescence intensity in individual hMGL lines in comparison to the 15 min time point, and normalized to WT at the 15 min time point (set to 1.0). Values represent mean ± SEM from n = 3 independent experiments. Mean PI values for the hMGL lines was quantified at the 3-h time point, and shown in the bar graph. Middle graph: mutant hMGL lines transfected with 25 nM control or APOE siRNAs were assayed for Aβ phagocytosis. Right graph: Mutant hMGL lines with endogenous APOEε3/ε4 allele combinations or edited APOEε3/ε3 alleles were assayed for Aβ phagocytosis. In G, analyses were assays were validated using two independently derived hMGL clones. Individual plots represent three replicates in n = 3 independent experiments. Graph depicts mean ± SEM of averaged values from independent experiments. Statistical significance was determined by one-way ANOVA with Tukey’s multiple comparison (*, P < 0.05; **, P < 0.01). Black significance values indicate significance within treatments within one hMGL line, and gray significance values indicate differences between like treatments between different hMGL lines.

