Figure S5.
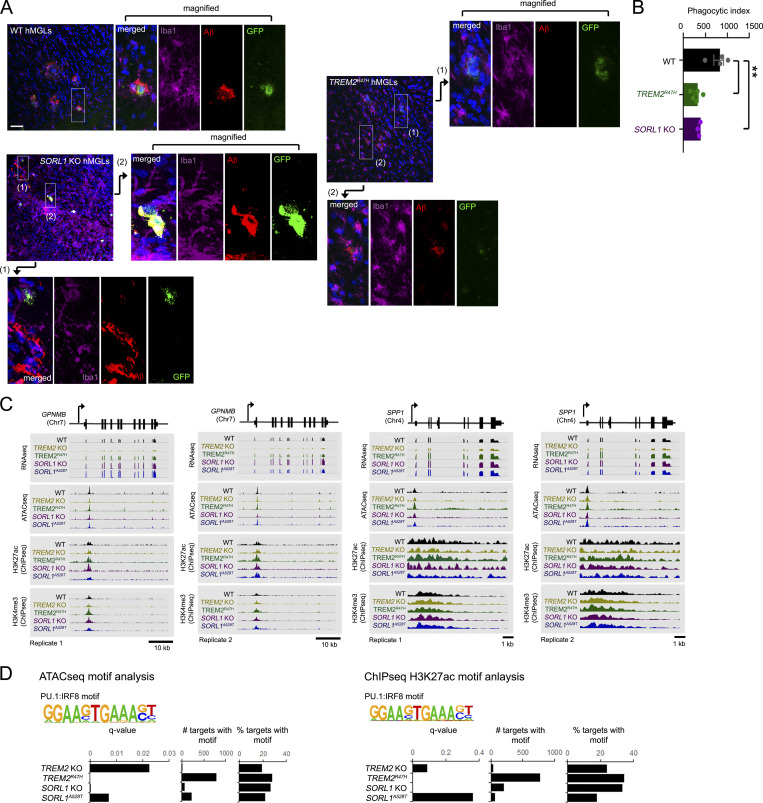
In vivo Aβ uptake and chromatin profiles in various AD mutant hMGLs. (A) GFP-expressing WT, TREM2R47H, and SORL1 KO hMGLs lines (derived from CX3CR1-2A-GFP ES lines; see Materials and methods) xenotransplanted in human MCSF knockin mouse brain cortex and coinjected with 555-Aβ oligomers were stained with antibodies to detect GFP (green), Iba1 (purple), Aβ (red, 555-Aβ) and DAPI (blue). Magnified images indicate intracellular Aβ in WT hMGLs (green), where TREM2R47H hMGLs largely failed to show overlap in hMGL/intracellular Aβ staining, while SORL1 KO hMGLs also showed incomplete overlap. Scale bar, 50 µM. (B) Phagocytosis of Aβ in xenotransplanted hMGLs were quantified in A. Statistical significance was determined by one-way ANOVA with Tukey’s multiple comparison (**, P < 0.01). Graph represents n = 3–5 animals for each group (each data point represents averages from 6–10 sagittal brain sections (30 µm) per animal; mean ± SEM) as determined by analysis of images from immunostained sections. (C) Epigenetic analysis of hMGL lines. The genome browser schematic and peak scans comparing mRNA levels and genomic epigenetic modification at GPNMB and SPP1 loci (duplicate scans) for WT, TREM2 KO, TREM2R47H, SORL1 KO, and SORL1A528T hMGLs. RNA-seq and normalized signals for ATAC-seq, H3K4me3, and H3K27ac ChIP-seq are shown in representative assays from hMGLs as indicated. (D) PU.1:IRF8 binding motifs identified by ATAC-seq (left) and anti-H3K27ac ChIP-seq (right) are quantified for significance (q-value), frequency, and percent relative frequency (% targets).

