Fig. 4.
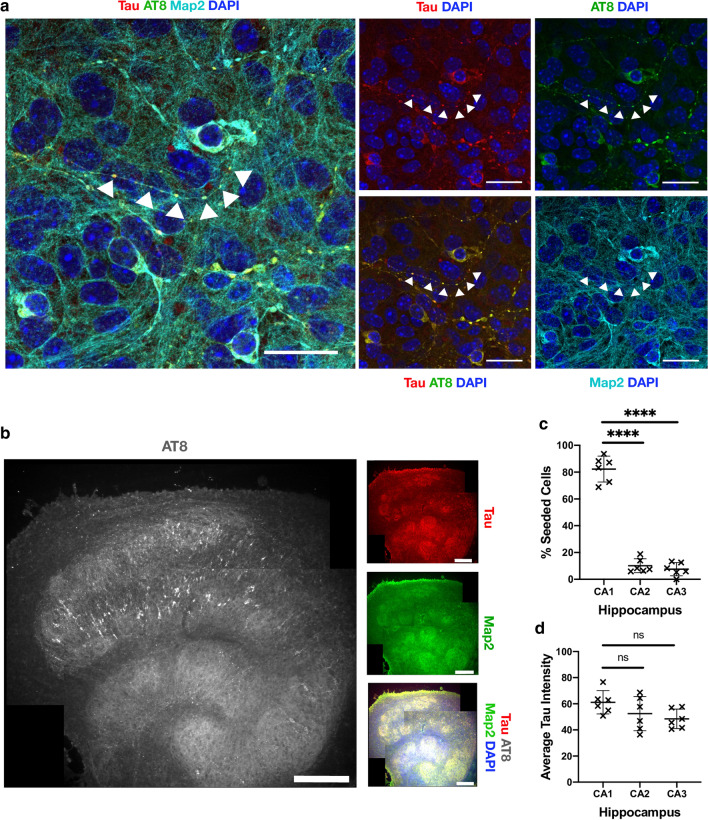
Seeded neurons localise to CA1 and display phospho-tau aggregates within intact nerve processes. a OHSCs were challenged with 100 nM recombinant tau assemblies to induce seeded aggregation. Hyperphosphorylated tau puncta can be observed along intact nerve processes (arrows) and within cell bodies. Scale bars, 25 µm. b Tiled image of representative OHSC challenged with 100 nM recombinant tau assemblies displays AT8 immunoreactivity predominantly in the CA1 subregion. Scale bars, 250 µm. c The distribution of seeded cells in hippocampal subregions was quantified by counting cells positive for AT8 aggregates. d Levels of tau, as quantified by immunofluorescence staining with pan-tau antibody, shows that CA1, CA2 and CA3 express similar levels of tau. Statistical significance for c and d determined by one-way ANOVA and Tukey’s post hoc multiple comparisons test (multiple fields imaged from N = 6 mice. ****P < 0.0001)

