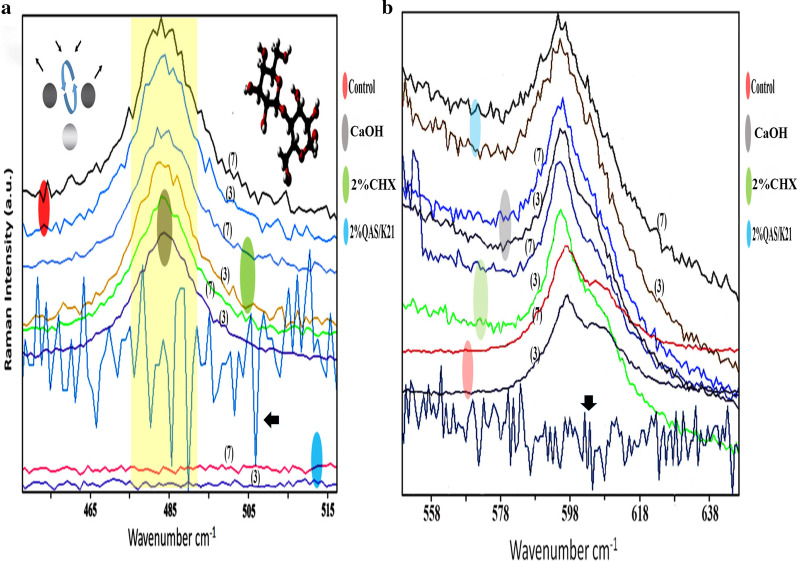
Fig. 3.
Raman spectra of E. faecalis biofilms on dentin disc specimens treated with different intracanal medicaments protocol. (a) Significant spectral differences of control and treated specimens can be seen in the 480–490 cm−1 region after normalization (region highlighted yellow). The Raman intensity on the y-axis represented the amount of amylopectin exopolysaccharide detected in an arbitrary unit, (3) represented the Raman analysis from dentin disc samples sent on the 3rd day while (7) represented samples from 7th day. In the 2%k21 case, the Raman fit was applied to the spectrum. While calculating, the weak curved sections, it was subtracted from the main spectrum producing the flattest baseline for 2%k21 at the same carbohydrate fingerprint region. The two spectra fall on the red, green, grey and blue regions belonging to the Raman intensity created by dentin disc specimens in control group, 2%CHX, Ca(OH)2 and 2%k21 respectively in A; and red, green, grey, and blue control group, 2%CHX, Ca(OH)2 and 2%k21 respectively in B. Raman peak acquired in same region during calibration process with silicon wafer indicated with black arrow showing remarkable difference between testing peaks and experimental groups. (b) Raman shift from 598–588 cm−1 presented the Raman effect caused by β-galactosidase. The β-COC ring deformations are the mode of vibrations due to the strong coupling due to the glycosidic ring skeletal deformations of the carbohydrate. The phospho-β-galactosidase is found in bacterial cytoplasm

