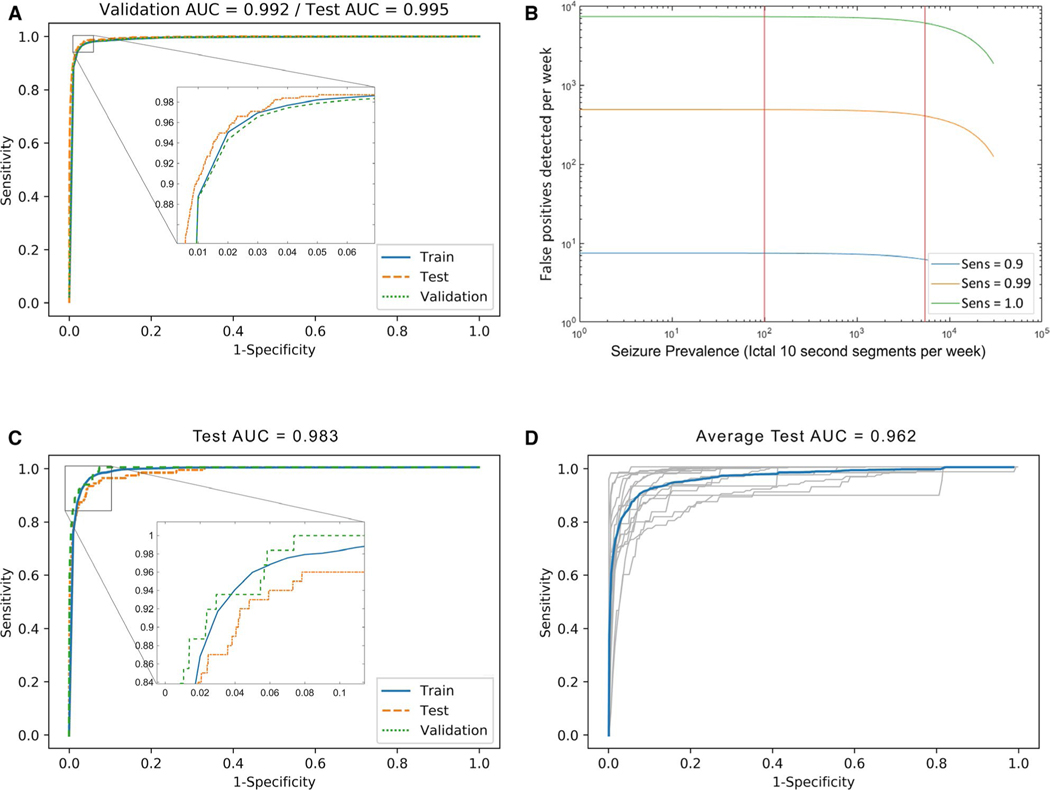
FIGURE 2.
Automated seizure-detection performance for the generalized linear model. For this analysis, 3054 ictal windows from 1012 seizures and 995 588 nonictal windows from the nonictal (interictal and preictal) segments were selected from 16 rats and pooled for this analysis. A, Method performance by receiver operating characteristic (ROC) curve for a pooled generalized linear model with ridge penalty, trained on 80% of all subject data pooled, and tested on the remaining hold-out 20% (test area under the curve [AUC] = 0.995). B, Performance visualized as false-positive seizures detected per week, at three sensitivity levels chosen for clinical relevance. Vertical red lines indicate boundaries of 95% confidence interval for seizure prevalence based on the Focal Epilepsy data set. C, Method performance by ROC for a pooled generalized linear model with ridge penalty, trained on 80% of all subject data, and tested on the held-out continuous last 24 h before the last recorded seizure, including the last seizure (test AUC = 0.983). D, Method performance by ROC for a generalized linear model with ridge penalty, trained on all data from all subjects except one, and tested on all data from the hold-out animal. ROC for each animal is shown in gray; mean ROC is shown in blue (mean test AUC = 0.962)

