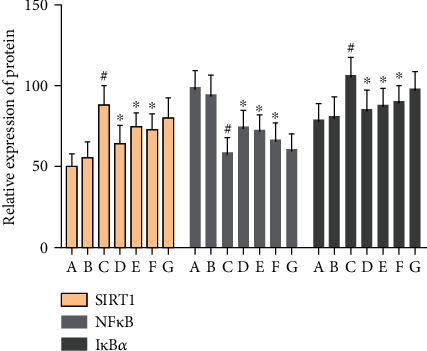
Figure 15.

Effect of MBHD on the expression of SIRT1, IκBα, and NF-κB p65 protein (A: normal group; B: sham operation group; C: model group; D: positive group; E: MBHD high-dose group; F: MBHD medium-dose group; G: MBHD low-dose group. Compared with the sham operation group, #P < 0.05; compared with model group, ∗P < 0.05).
